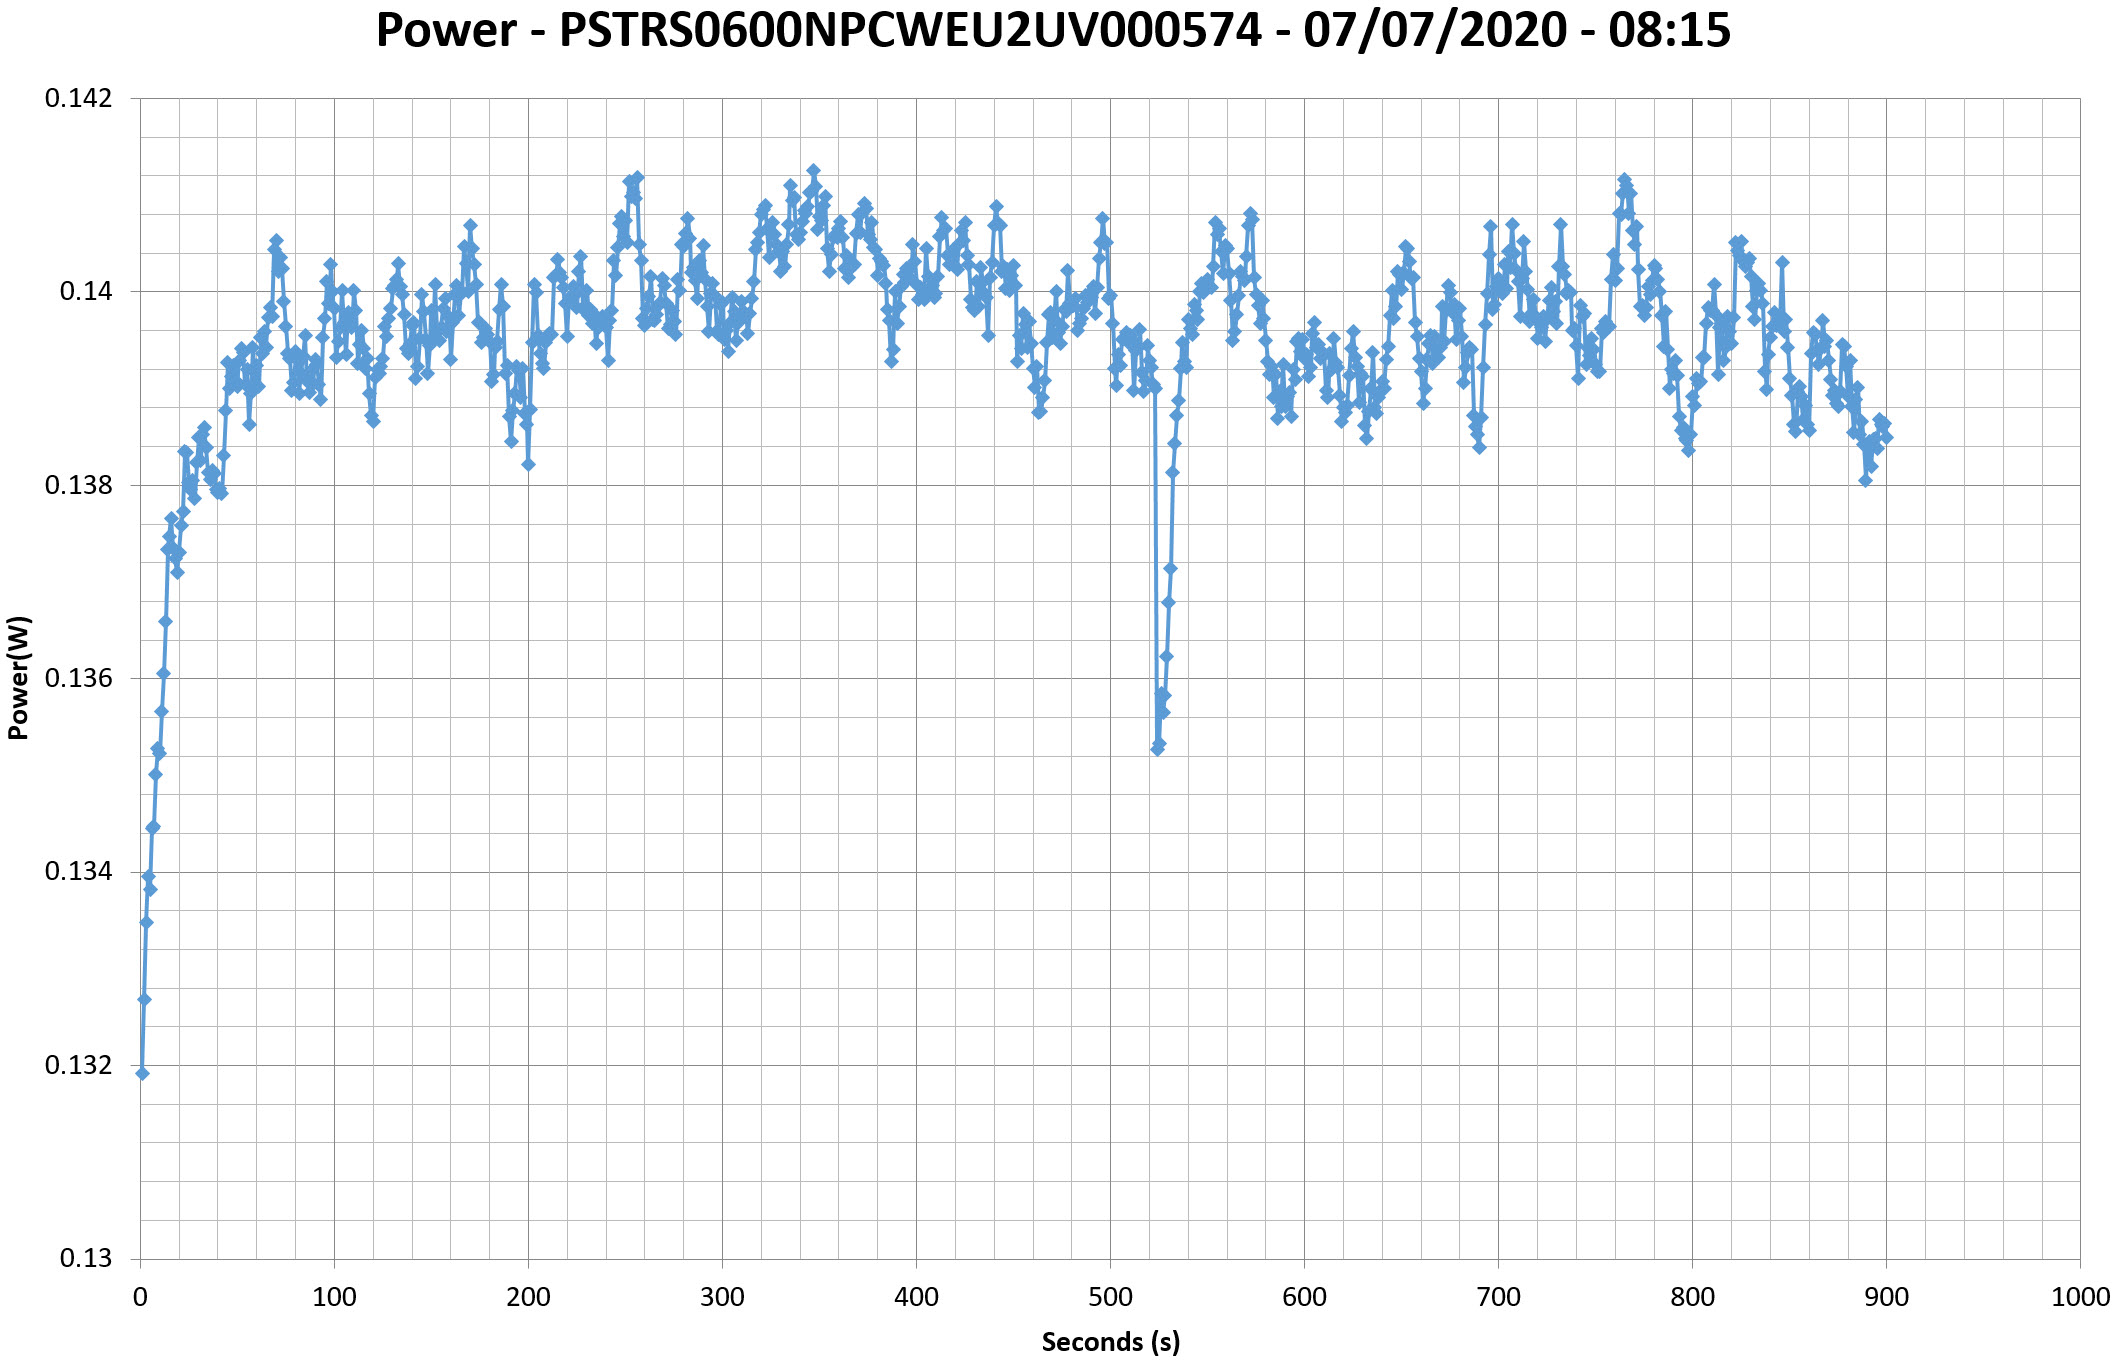
This graph is generated by the PPA Standby Power Analysis software which takes full control of the power analyzer during the whole procedure. This application features all of the EN50564 & IEC62301 test limits for standby power software testing
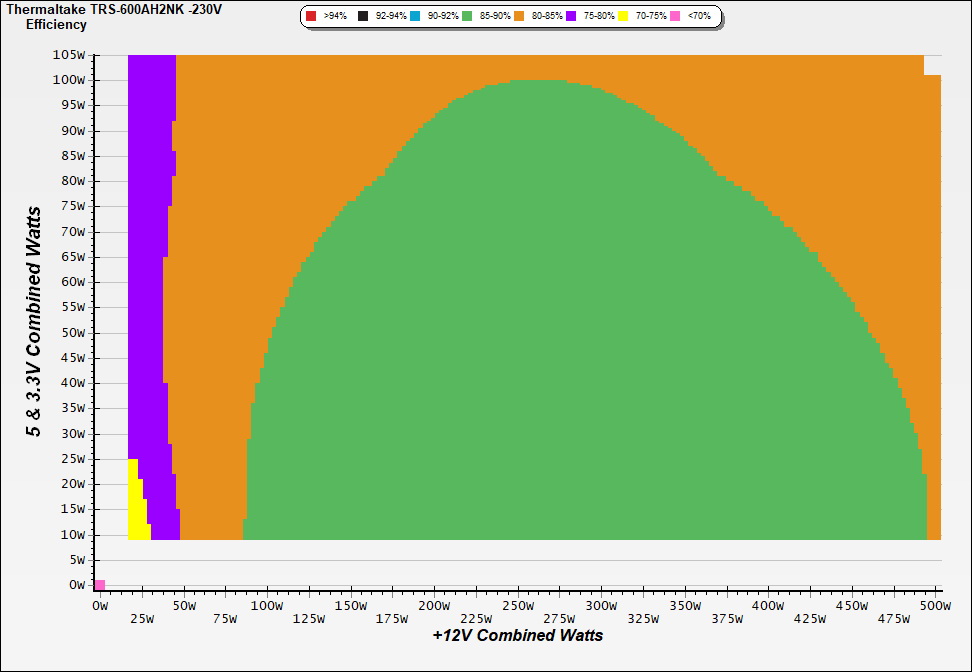
Efficiency Graph
230V
INFO
This graph depicts the PSU`s efficiency throughout its entire operational range. For the generation of the efficiency and noise graphs we set our loaders to auto mode through our custom-made software before trying thousands of possible load combinations
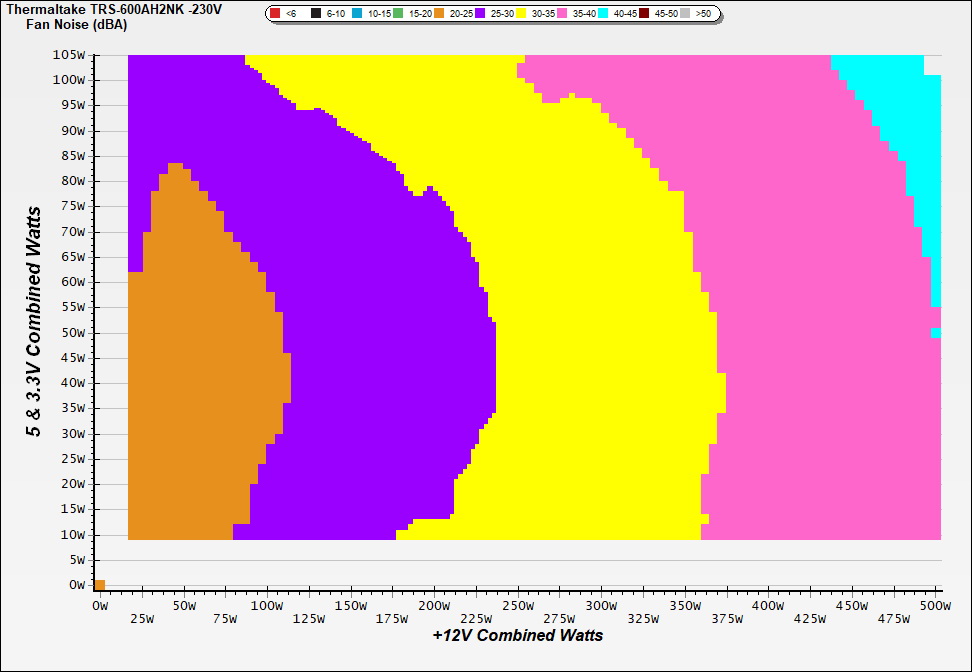
Noise Graph
230V
INFO
The PSU`s noise in its entire operational range and under 30-32 °C ambient is depicted in this graph. The X axis represents the load on the +12V rail(s) while the Y axis is the load on the minor rails
Conducted Emissions EN55032 & CISPR 32
Indicative Performance
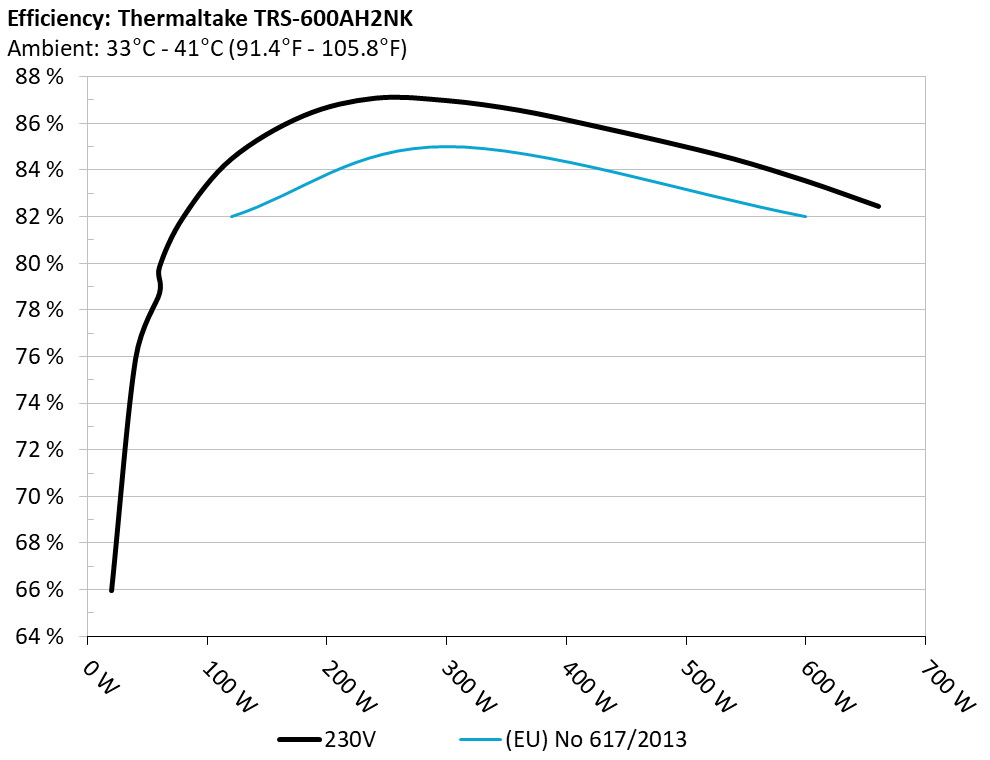
Efficiency under high ambient temperature
INFO
The PSU`s efficiency under high ambient temperatures with 115V and 230V input. For this graph the results of the 10-110% load regulation table are used
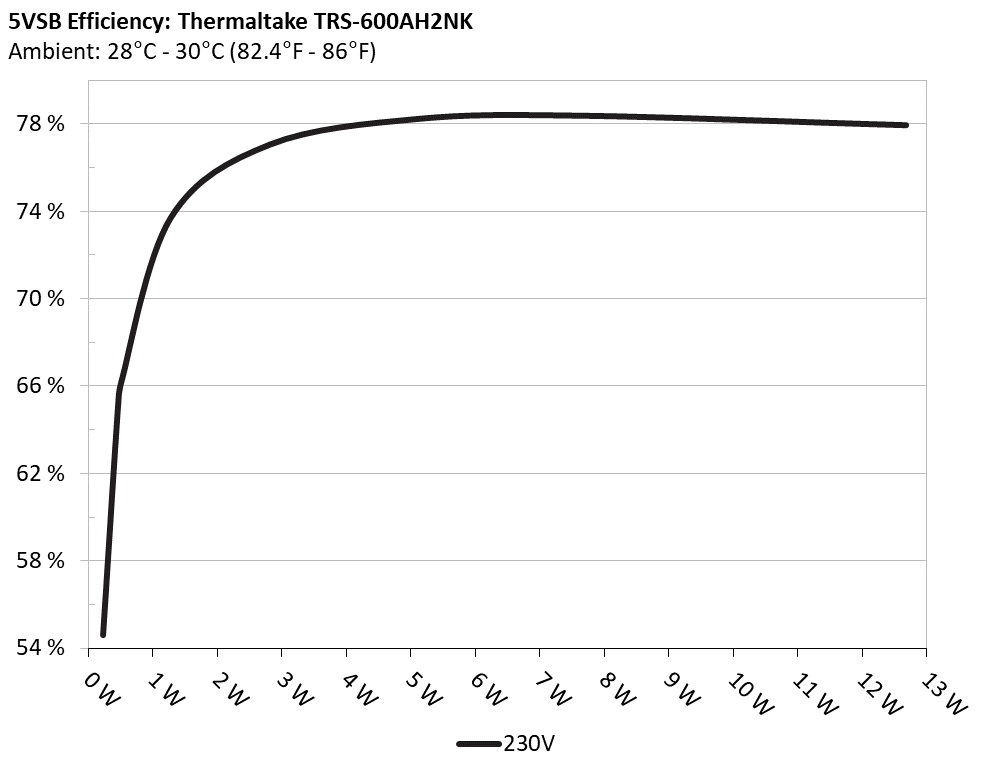
5VSB Efficiency
INFO
This graph depicts the efficiency levels of the 5VSB rail with 115V and 230V input
5VSB Efficiency (ERP LOT 3/6 & CEC) 230V
Test #
5VSB
DC/AC (Watts)
Efficiency
PF/AC Volts
1
0.045A
0.231
54.610%
0.026
5.133V
0.423
230.37V
2
0.090A
0.462
65.070%
0.043
5.132V
0.710
230.37V
3
0.550A
2.817
77.073%
0.184
5.121V
3.655
230.36V
4
1.000A
5.112
78.249%
0.257
5.110V
6.533
230.36V
5
1.500A
7.649
78.395%
0.302
5.098V
9.757
230.36V
6
2.500A
12.685
77.961%
0.348
5.073V
16.271
230.36V
Protection Features
Supplementary Tests (For Reference)
Typical Load Tests 230V
Test #
12V
5V
3.3V
5VSB
DC/AC (Watts)
Efficiency
Fan Speed (RPM)
PSU Noise (dB[A])
Temps (In/Out)
PF/AC Volts
1
3.188A
1.935A
1.953A
0.982A
60.008
78.732%
1058
24.3
35.46°C
0.885
12.049V
5.167V
3.378V
5.092V
76.218
38.27°C
230.38V
2
7.411A
2.913A
2.942A
1.183A
120.042
84.496%
1080
24.8
36.10°C
0.934
12.028V
5.150V
3.365V
5.072V
142.069
39.62°C
230.39V
3
12.000A
3.405A
3.445A
1.386A
180.047
86.343%
1243
29.8
36.25°C
0.952
11.999V
5.141V
3.353V
5.053V
208.525
40.24°C
230.38V
4
16.576A
3.900A
3.950A
1.589A
240.055
87.102%
1458
34.0
36.69°C
0.960
11.996V
5.130V
3.342V
5.035V
275.601
41.26°C
230.37V
5
20.773A
4.894A
4.956A
1.796A
300.094
86.999%
1551
36.1
37.41°C
0.967
12.015V
5.109V
3.329V
5.013V
344.938
42.64°C
230.39V
6
25.010A
5.898A
5.972A
2.001A
360.041
86.585%
1709
38.2
38.50°C
0.970
12.005V
5.088V
3.315V
4.992V
415.825
44.53°C
230.38V
7
29.235A
6.909A
6.998A
2.214A
419.797
85.946%
1845
40.0
38.67°C
0.972
11.995V
5.068V
3.302V
4.969V
488.444
45.19°C
230.39V
8
33.541A
7.928A
8.032A
2.427A
480.267
85.244%
1909
41.3
38.85°C
0.975
11.981V
5.046V
3.287V
4.947V
563.405
46.26°C
230.39V
9
38.275A
8.441A
8.552A
2.435A
539.601
84.492%
1966
42.5
39.69°C
0.978
11.942V
5.036V
3.275V
4.930V
638.639
47.93°C
230.42V
10
43.123A
8.957A
9.108A
2.547A
600.334
83.541%
1970
42.6
39.92°C
0.979
11.899V
5.025V
3.261V
4.909V
718.607
48.95°C
230.44V
11
48.441A
8.958A
9.139A
2.555A
660.383
82.460%
1970
42.6
40.85°C
0.981
11.832V
5.026V
3.250V
4.894V
800.852
51.66°C
230.40V
CL1
0.118A
13.001A
13.000A
0.001A
106.430
74.011%
2075
44.7
37.38°C
0.937
13.350V
4.738V
3.327V
5.061V
143.803
42.38°C
230.41V
CL2
42.029A
0.999A
1.001A
1.000A
493.816
85.434%
1885
41.2
40.04°C
0.976
11.427V
5.242V
3.311V
5.000V
578.007
48.73°C
230.40V
The results above are not used in the certification process
Light Load Tests 230V
Test #
12V
5V
3.3V
5VSB
DC/AC (Watts)
Efficiency
Fan Speed (RPM)
PSU Noise (dB[A])
PF/AC Volts
1
1.229A
0.481A
0.487A
0.195A
19.998
65.970%
1028
24.1
0.716
12.083V
5.195V
3.390V
5.124V
30.314
230.39V
2
2.458A
0.964A
0.974A
0.391A
39.988
75.913%
1031
24.3
0.830
12.079V
5.188V
3.386V
5.114V
52.676
230.39V
3
3.691A
1.448A
1.465A
0.588A
60.017
79.854%
1036
24.6
0.882
12.073V
5.181V
3.380V
5.103V
75.158
230.39V
4
4.930A
1.933A
1.956A
0.786A
79.965
82.008%
1047
24.8
0.910
12.042V
5.170V
3.375V
5.093V
97.509
230.38V
The results above are not used in the certification process
Ripple Measurements 230V
Test
12V
5V
3.3V
5VSB
Pass/Fail
10% Load
10.20mV
6.80mV
7.30mV
6.30mV
Pass
20% Load
12.00mV
6.00mV
7.50mV
6.40mV
Pass
30% Load
14.60mV
6.50mV
7.60mV
6.40mV
Pass
40% Load
16.50mV
7.40mV
8.20mV
6.30mV
Pass
50% Load
19.10mV
7.80mV
9.40mV
6.50mV
Pass
60% Load
22.30mV
9.30mV
10.10mV
11.50mV
Pass
70% Load
26.70mV
10.00mV
11.80mV
13.50mV
Pass
80% Load
29.60mV
11.20mV
21.10mV
16.00mV
Pass
90% Load
33.40mV
13.60mV
25.00mV
19.90mV
Pass
100% Load
41.70mV
18.20mV
31.90mV
22.40mV
Pass
110% Load
47.40mV
21.00mV
37.20mV
34.30mV
Pass
Crossload1
12.20mV
51.10mV
22.40mV
12.20mV
Fail
Crossload2
39.40mV
13.80mV
20.60mV
14.00mV
Pass
The results above are not used in the certification process
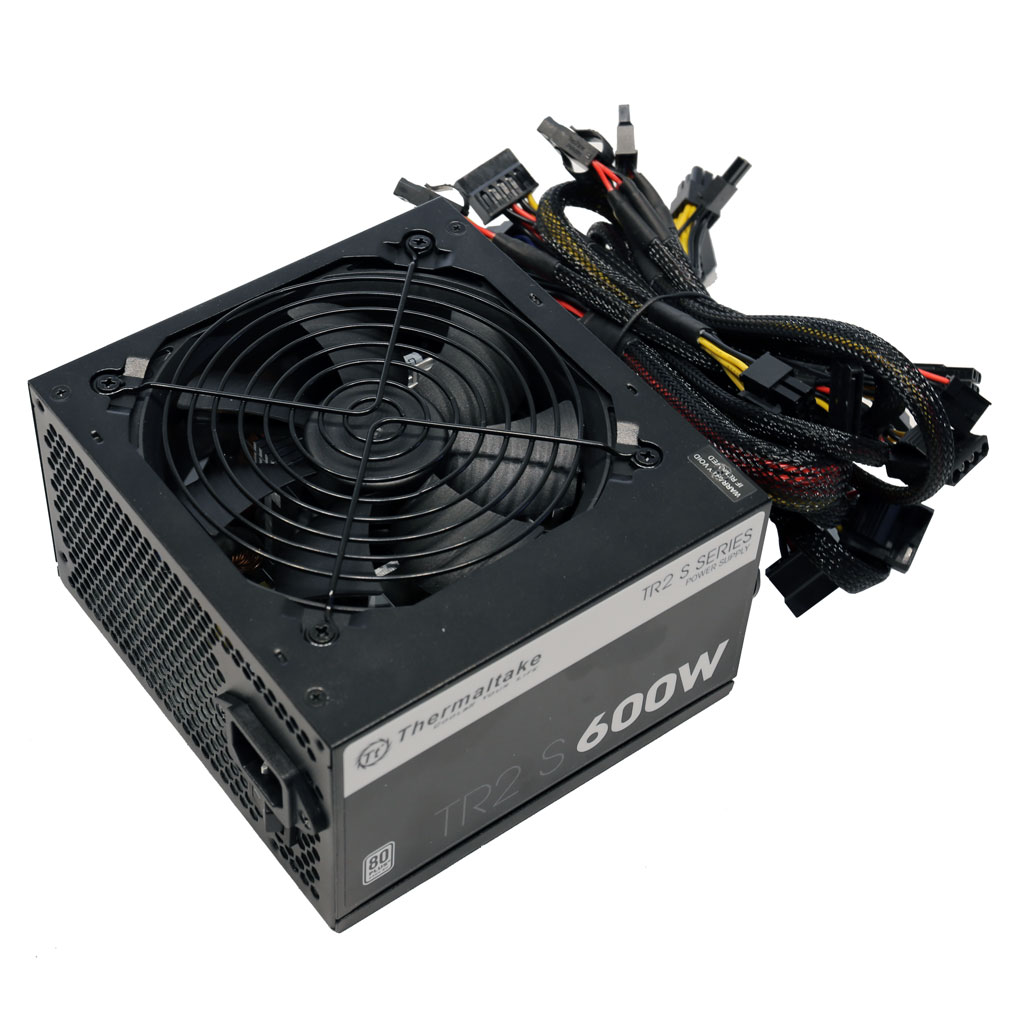
Thermaltake TR2 S 600W
Top side
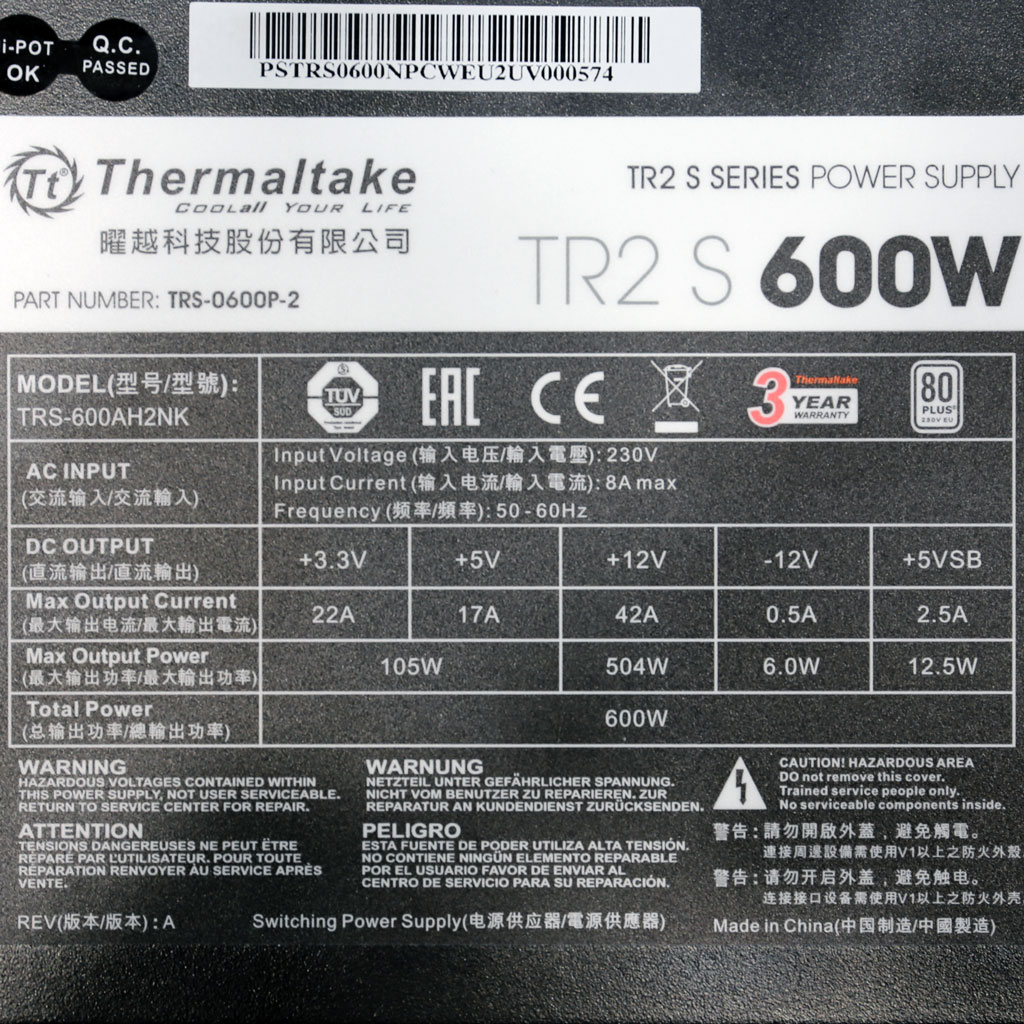
Power specifications label
All data and graphs included in this test report can be used by any individual on the following conditions: › It should be mentioned that the test results are provided by Cybenetics › The link to the original test results document should be provided in any case
Cybenetics offers the ETA and Lambda voluntary certification programs, through which the efficient and silent power supplies are promoted