Cables and Connectors(Non-accredited measurements)
Captive Cables
Description
Cable Count
Connector Count (Total)
Gauge
In Cable Capacitors
ATX connector 20+4 pin (500mm)
1
1
18-20AWG
No
4 pin EPS12V (500mm)
1
1
18AWG
No
8 pin EPS12V (500mm)
1
1
18AWG
No
SATA (500mm+160mm+160mm)
1
3
18AWG
No
4-pin Molex (500mm+150mm+150mm)
1
3
18AWG
No
4-pin Molex (500mm+150mm) / FDD (+150mm)
1
2 / 1
18-22AWG
No
Test Results
Temperature & Compliance Info
Temperature Range (°C /°F)
30-32 / 86-89.6
ErP Lot 3/6 Ready
✗
(EU) No 617/2013 Compliance
Performance Summary 230V
效率評比
BRONZE
Average Efficiency (>1450 load combinations)
82.694%
Average Noise Output (>1450 Load Combinations)
0.00dBA
Average PF (>1450 Load Combinations)
0.903
Efficiency With 10W (≤500W) or 2% (>500W) Load
0.000%
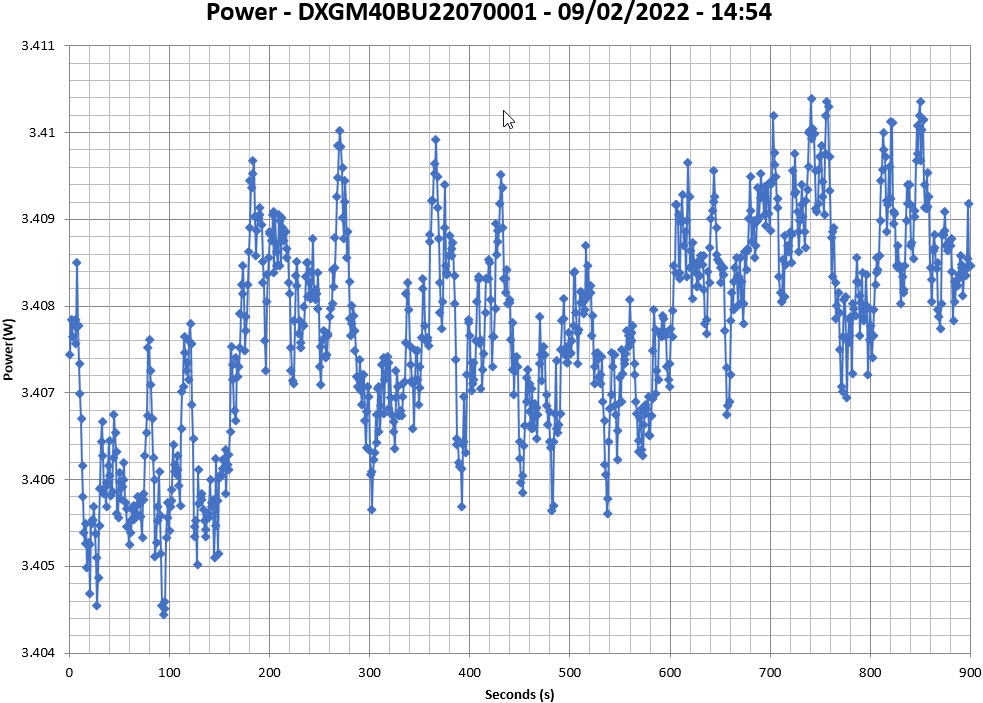
Standby Power Consumption
3.4085W
12V Ripple (Full Load)
33.30mV
5V Ripple (Full Load)
0.00mV
3.3V Ripple (Full Load)
0.00mV
5VSB Ripple (Full Load)
13.48mV
12V Load Regulation
1.16%
5V Load Regulation
0.00%
3.3V Load Regulation
0.00%
5VSB Load Regulation
5.10%
Inrush Current
95.000A
12V Transient Response (150%)
0.00V
5V Transient Response (150%)
V
3.3V Transient Response (150%)
V
5VSB Transient Response (150%)
V
Hold-Up Time & Power Ok Signal
14.80ms
AC Loss to PWR_OK Hold Up Time
9.70ms
PWR_OK Inactive to DC Loss Delay
5.10ms
PSU Timings: T1 (20% / 100%)
160.0ms
154.0ms
PSU Timings: T3 (20% / 100%)
298.0ms
296.0ms
OPP (0.00°C / 0.00°C)
0.00%
0.00%
Hold-Up Time & Power Ok Signal
Hold-Up Time (ms)
14.8
AC Loss to PWR_OK Hold Up Time (ms)
9.7
PWR_OK Inactive to DC Loss Delay (ms)
5.1
待機電源消耗
Tables 230V
Graphs 230V
INFO
This graph is generated by the PPA Standby Power Analysis software which takes full control of the power analyzer during the whole procedure. This application features all of the EN50564 & IEC62301 test limits for standby power software testing
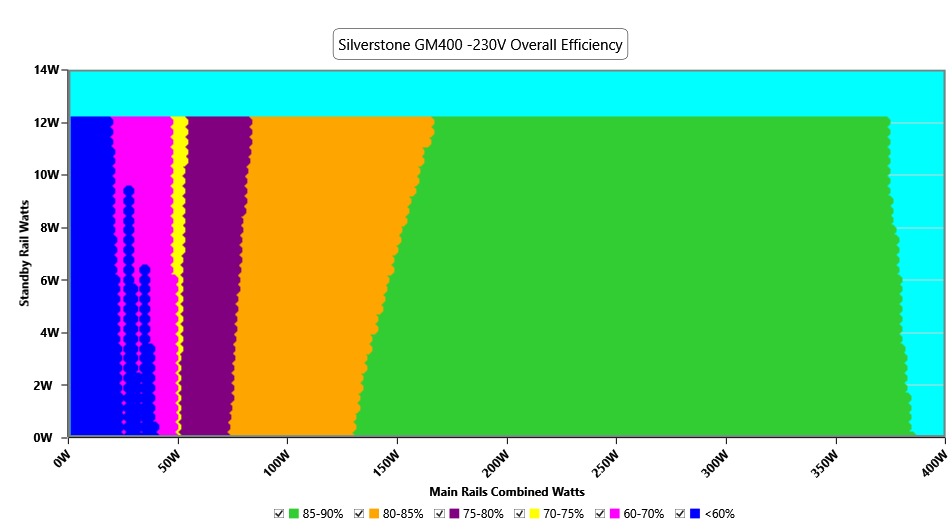
Efficiency Graph
230V
INFO
This graph depicts the PSU`s efficiency throughout its entire operational range. For the generation of the efficiency and noise graphs we set our loaders to auto mode through our custom-made software before trying thousands of possible load combinations
Noise Graph
230V
Conducted Emissions EN55032 & CISPR 32
Indicative Performance
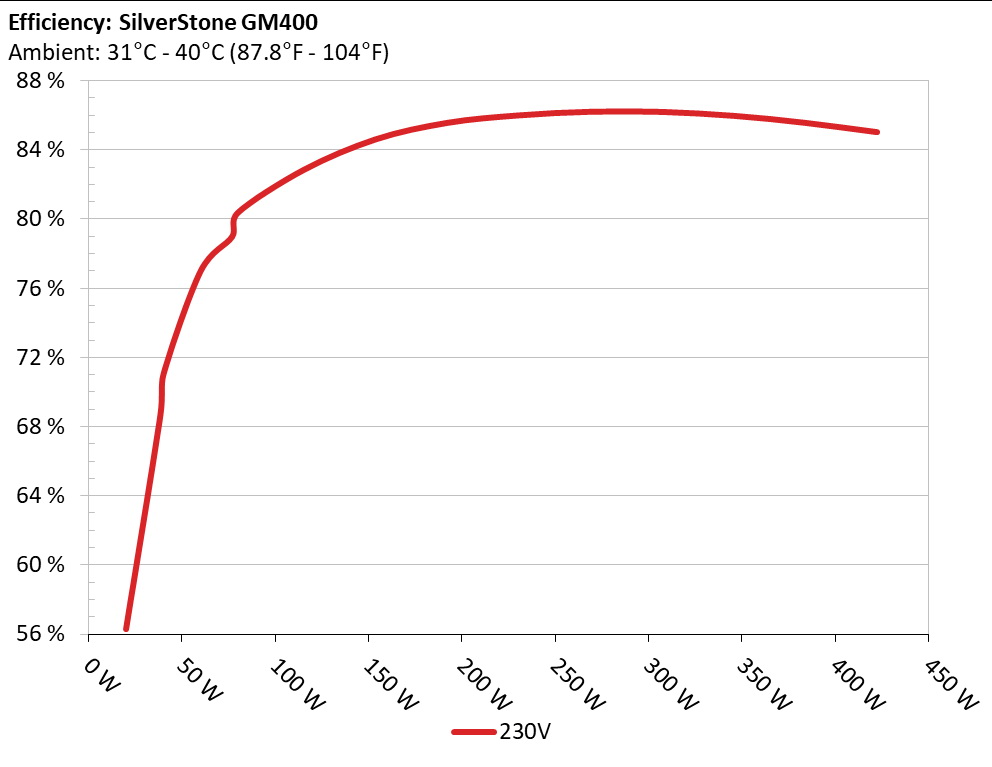
Efficiency under high ambient temperature
INFO
The PSU`s efficiency under high ambient temperatures with 115V and 230V input. For this graph the results of the 10-110% load regulation table are used
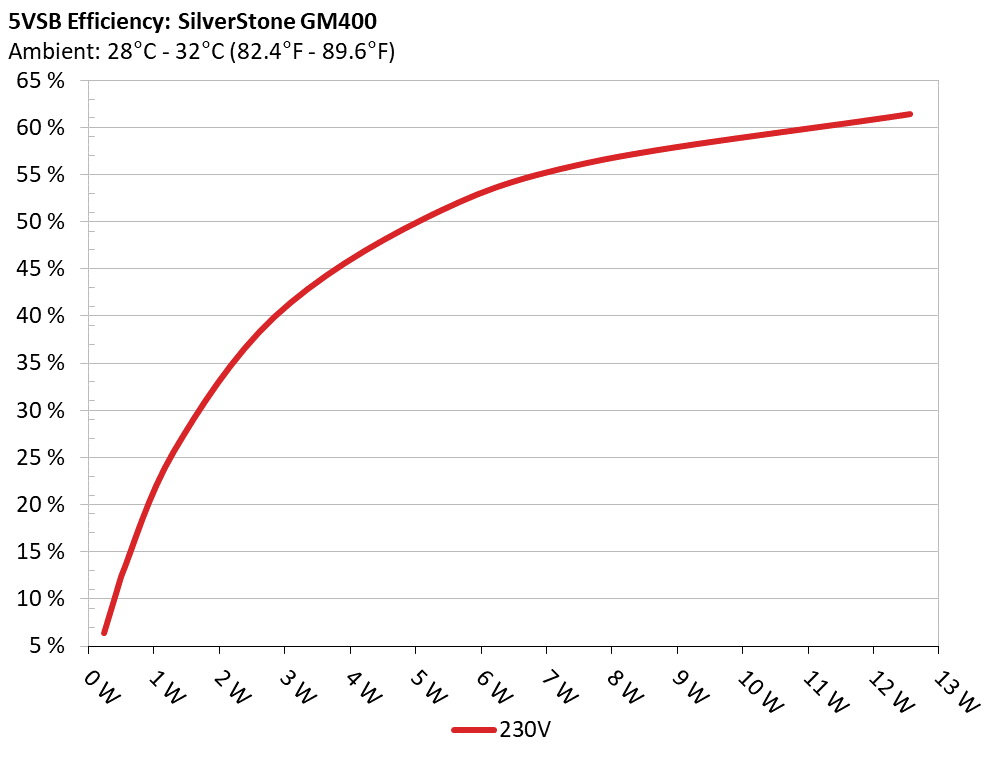
5VSB Efficiency
INFO
This graph depicts the efficiency levels of the 5VSB rail with 115V and 230V input
5VSB Efficiency (ERP LOT 3/6 & CEC) 230V
Test #
5VSB
DC/AC (Watts)
Efficiency
PF/AC Volts
1
0.045A
0.236W
6.358%
0.102
5.238V
3.712W
230.27V
2
0.09A
0.47W
11.731%
0.11
5.224V
4.006W
230.27V
3
0.55A
2.837W
39.863%
0.181
5.158V
7.118W
230.24V
4
1A
5.121W
50.271%
0.237
5.12V
10.187W
230.24V
5
1.5A
7.629W
56.212%
0.285
5.085V
13.571W
230.24V
6
2.5A
12.552W
61.373%
0.35
5.02V
20.453W
230.24V
Protection Features
Supplementary Tests (For Reference)
Typical Load Tests 230V
Test
Main Rail
Standby Rail
DC/AC (Watts)
Efficiency
Temps (In/Out)
PF/AC Volts
10%
2.756A
0.982A
38.408
68.681%
34.56°C
0.683
12.123V
5.093V
55.922
38.73°C
230.24V
20%
5.845A
1.183A
76.819
78.986%
34.57°C
0.818
12.117V
5.07V
97.256
39.01°C
230.24V
30%
8.939A
1.387A
115.188
82.852%
35.2°C
0.892
12.102V
5.048V
139.029
39.89°C
230.24V
40%
12.045A
1.592A
153.641
84.614%
35.57°C
0.928
12.091V
5.026V
181.579
40.51°C
230.25V
50%
15.154A
1.798A
192.023
85.57%
35.96°C
0.947
12.077V
5.006V
224.403
41.52°C
230.25V
60%
18.281A
2A
230.447
86.006%
36.42°C
0.96
12.060V
4.985V
267.943
42.72°C
230.25V
70%
21.412A
2.217A
268.858
86.216%
36.9°C
0.965
12.043V
4.964V
311.842
44.24°C
230.25V
80%
24.596A
2.324A
307.298
86.202%
37.43°C
0.968
12.026V
4.95V
356.486
45.85°C
230.25V
90%
27.808A
2.432A
345.841
85.975%
38.57°C
0.973
12.005V
4.935V
402.256
47.58°C
230.25V
100%
30.977A
2.539A
383.913
85.572%
39.01°C
0.975
11.990V
4.924V
448.641
49.44°C
230.25V
110%
34.224A
2.541A
422.287
85.035%
40.45°C
0.975
11.974V
4.919V
496.605
51.71°C
230.24V
The results above are not used in the certification process
Light Load Tests 230V
Test
Main Rail
Standby Rail
DC/AC (Watts)
Efficiency
Temps (In/Out)
PF/AC Volts
20W
1.566A
0.193A
20.001
56.274%
31.36°C
0.569
12.128V
5.175V
35.542
34.4°C
230.22V
40W
3.176A
0.291A
40.007
71.01%
32.65°C
0.686
12.126V
5.156V
56.339
35.83°C
230.22V
60W
4.785A
0.389A
60.005
77.005%
33.55°C
0.763
12.123V
5.141V
77.924
36.98°C
230.22V
80W
6.392A
0.488A
79.95
80.372%
33.62°C
0.826
12.116V
5.127V
99.476
37.31°C
230.23V
The results above are not used in the certification process
Ripple Measurements 230V
Test
Main Rail
Standby Rail
Pass/Fail
10% Load
14.7 mV
6.2 mV
Pass
20% Load
16.2 mV
6.4 mV
Pass
30% Load
17.0 mV
6.9 mV
Pass
40% Load
24.8 mV
7.7 mV
Pass
50% Load
23.6 mV
8.1 mV
Pass
60% Load
22.7 mV
8.4 mV
Pass
70% Load
23.7 mV
9.4 mV
Pass
80% Load
26.4 mV
10.9 mV
Pass
90% Load
28.5 mV
11.9 mV
Pass
100% Load
32.2 mV
13.5 mV
Pass
110% Load
35.3 mV
14.6 mV
Pass
The results above are not used in the certification process