Cables and Connectors(Non-accredited measurements)
Modular Cables
Description
Cable Count
Connector Count (Total)
Gauge
In Cable Capacitors
ATX connector 20+4 pin (650mm)
1
1
16-22AWG
No
4+4 pin EPS12V (700mm)
3
3
16AWG
No
6+2 pin PCIe (700mm)
6
6
16AWG
No
12+4 pin PCIe (700mm) (600W)
2
2
16-26AWG
No
SATA (500mm+100mm+100mm+100mm)
2
8
18AWG
No
4-pin Molex (500+150mm+150mm+150mm)
1
4
18AWG
No
FDD Adapter (+100mm)
1
1
22AWG
No
AC Power Cord (1680mm) - C19 coupler
1
1
14AWG
No
Test Results
Temperature & Compliance Info
Temperature Range (°C /°F)
30-32 / 86-89.6
ErP Lot 3/6 Ready
✓
(EU) No 617/2013 Compliance
✓
ALPM (Alternative Low Power Mode) compatible
✓
ATX v3.1 PSU Power Excursion
✓
Performance Summary
Wirkungsgrad
TITANIUM
Lautstärkeklasse
A+
Average Efficiency (>1450 load combinations)
91.170%
Average Noise Output (>1450 Load Combinations)
17.83dBA
Average PF (>1450 Load Combinations)
0.994
Efficiency With 10W (≤500W) or 2% (>500W) Load
73.229%
Standby Power Consumption
0.0602W
12V Ripple (Full Load)
25.81mV
5V Ripple (Full Load)
13.01mV
3.3V Ripple (Full Load)
16.02mV
5VSB Ripple (Full Load)
16.29mV
12V Load Regulation
0.30%
5V Load Regulation
0.38%
3.3V Load Regulation
0.33%
5VSB Load Regulation
2.20%
Inrush Current
Too low to detect
Wirkungsgrad
TITANIUM
Lautstärkeklasse
A+
Average Efficiency (>1450 load combinations)
93.114%
Average Noise Output (>1450 Load Combinations)
17.99dBA
Average PF (>1450 Load Combinations)
0.970
Efficiency With 10W (≤500W) or 2% (>500W) Load
72.555%
Standby Power Consumption
0.1109W
12V Ripple (Full Load)
24.91mV
5V Ripple (Full Load)
14.17mV
3.3V Ripple (Full Load)
15.93mV
5VSB Ripple (Full Load)
16.29mV
12V Load Regulation
0.25%
5V Load Regulation
0.34%
3.3V Load Regulation
0.48%
5VSB Load Regulation
2.16%
Inrush Current
Too low to detect
12V Transient Response (200%)
11.62V
5V Transient Response (200%)
4.944V
3.3V Transient Response (200%)
3.189V
5VSB Transient Response (200%)
4.855V
Hold-Up Time & Power Ok Signal
29.50ms
AC Loss to PWR_OK Hold Up Time
25.90ms
PWR_OK Inactive to DC Loss Delay
3.60ms
PSU Timings: T1 (20% / 100%)
148.0ms
141.0ms
PSU Timings: T3 (20% / 100%)
123.0ms
122.0ms
12V OCP (28.2°C / 41.3°C)
133.20A (133.20%), 12.177V
133.40A (133.40%), 12.168V
5V OCP (28.2°C / 41.3°C)
32.05A (145.68%), 4.993V
31A (140.91%), 4.99V
3.3V OCP (28.2°C / 41.3°C)
29.5A (134.09%), 3.297V
27A (122.73%), 3.308V
5VSB OCP (28.2°C / 41.3°C)
3.9A (130.00%), 4.93V
3.8A (126.67%), 4.933V
OPP (29.67°C / 40.91°C)
133.59%
133.59%
Hold-Up Time & Power Ok Signal
Hold-Up Time (ms)
29.5
AC Loss to PWR_OK Hold Up Time (ms)
25.9
PWR_OK Inactive to DC Loss Delay (ms)
3.6
Stromverbrauch im Ruhezustand
Tables
Detailed Results
Average
Min
Limit Min
Max
Limit Max
Result
Mains Voltage RMS:
115.08 V
115.04 V
113.85 V
115.11 V
116.15 V
PASS
Mains Frequency:
60.00 Hz
59.99 Hz
59.40 Hz
60.01 Hz
60.60 Hz
PASS
Mains Voltage CF:
1.416
1.415
1.340
1.418
1.490
PASS
Mains Voltage THD:
0.13 %
0.09 %
N/A
0.18 %
2.00 %
PASS
Real Power:
0.060 W
0.007 W
N/A
0.104 W
N/A
N/A
Apparent Power:
8.998 W
8.609 W
N/A
9.396 W
N/A
N/A
Power Factor:
0.009
N/A
N/A
N/A
N/A
N/A
Detailed Results
Average
Min
Limit Min
Max
Limit Max
Result
Mains Voltage RMS:
231.02 V
230.91 V
227.70 V
231.08 V
232.30 V
PASS
Mains Frequency:
50.00 Hz
49.99 Hz
49.50 Hz
50.01 Hz
50.50 Hz
PASS
Mains Voltage CF:
1.417
1.416
1.340
1.419
1.490
PASS
Mains Voltage THD:
0.17 %
0.14 %
N/A
0.28 %
2.00 %
PASS
Real Power:
0.111 W
0.065 W
N/A
0.190 W
N/A
N/A
Apparent Power:
29.627 W
28.755 W
N/A
30.535 W
N/A
N/A
Power Factor:
0.003
N/A
N/A
N/A
N/A
N/A
Graphs
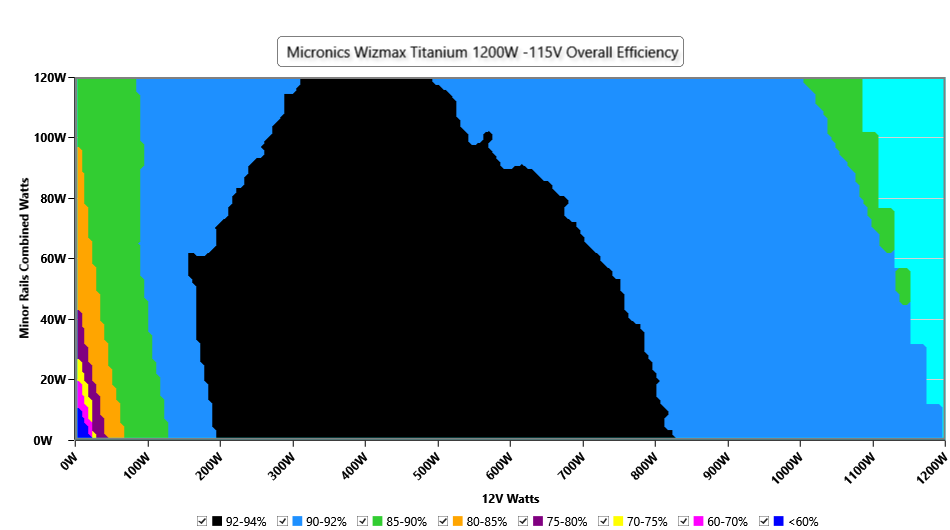
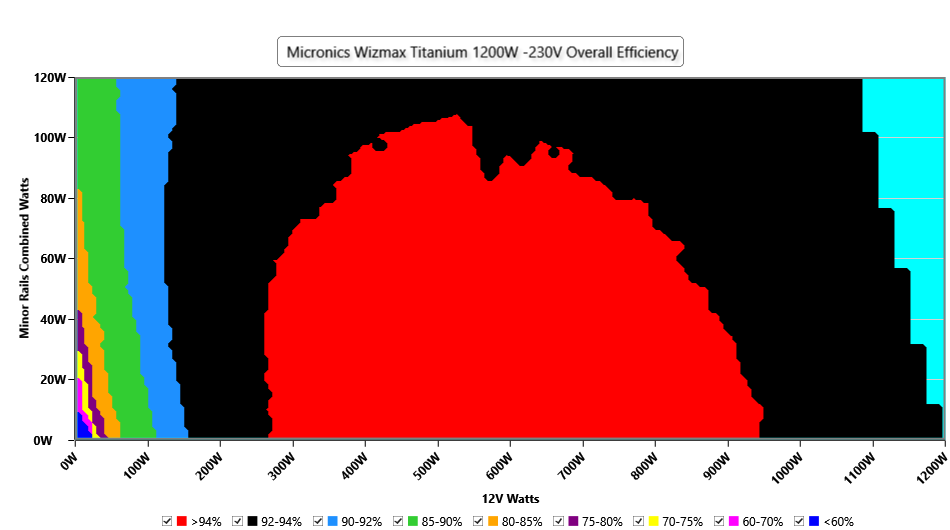
Efficiency Graph
INFO
This graph depicts the PSU`s efficiency throughout its entire operational range. For the generation of the efficiency and noise graphs we set our loaders to auto mode through our custom-made software before trying thousands of possible load combinations
INFO
This graph depicts the PSU`s efficiency throughout its entire operational range. For the generation of the efficiency and noise graphs we set our loaders to auto mode through our custom-made software before trying thousands of possible load combinations
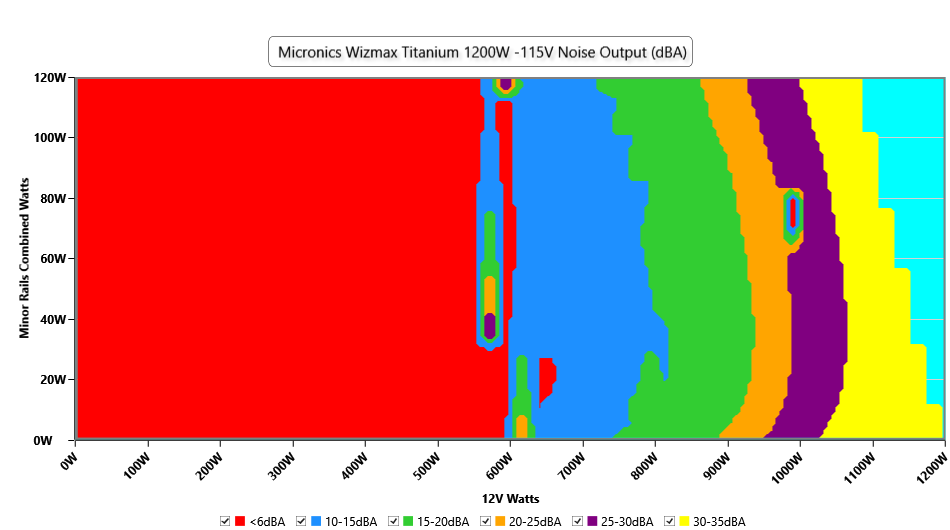
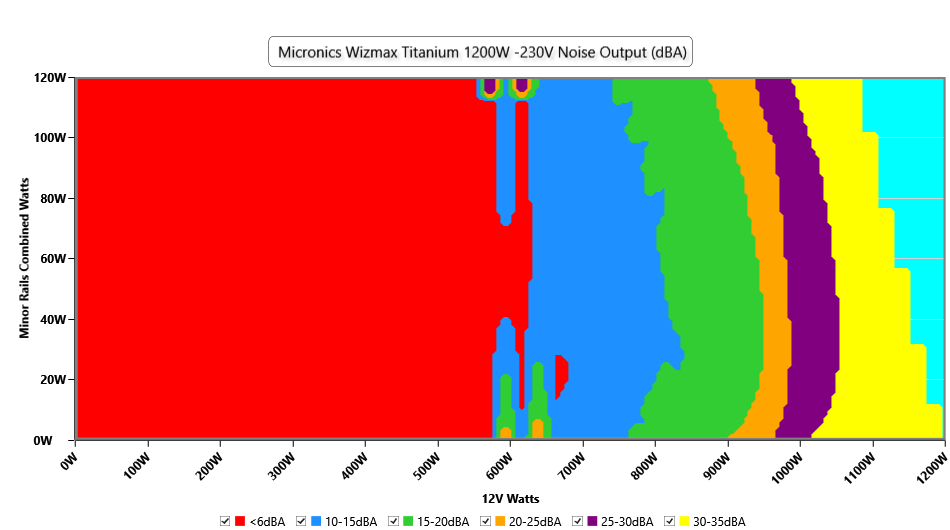
Noise Graph
INFO
The PSU`s noise in its entire operational range and under 30-32 °C ambient is depicted in this graph. The X axis represents the load on the +12V rail(s) while the Y axis is the load on the minor rails
INFO
The PSU`s noise in its entire operational range and under 30-32 °C ambient is depicted in this graph. The X axis represents the load on the +12V rail(s) while the Y axis is the load on the minor rails
Conducted Emissions EN55032 & CISPR 32
Indicative Performance
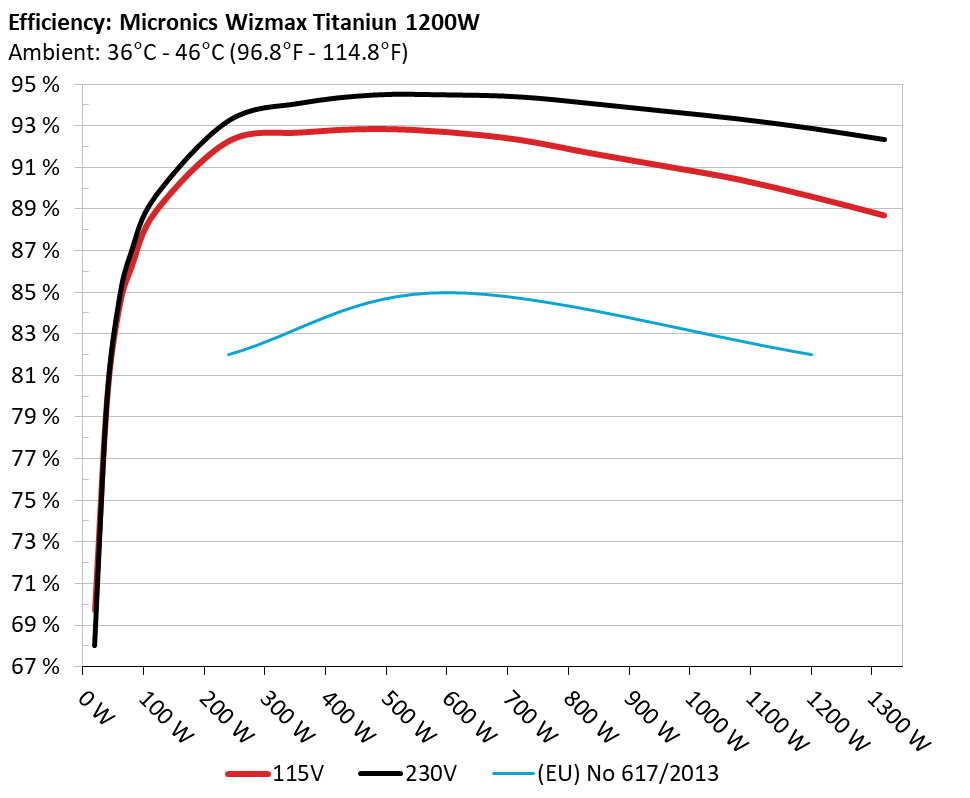
Efficiency under high ambient temperature
INFO
The PSU`s efficiency under high ambient temperatures with 115V and 230V input. For this graph the results of the 10-110% load regulation table are used
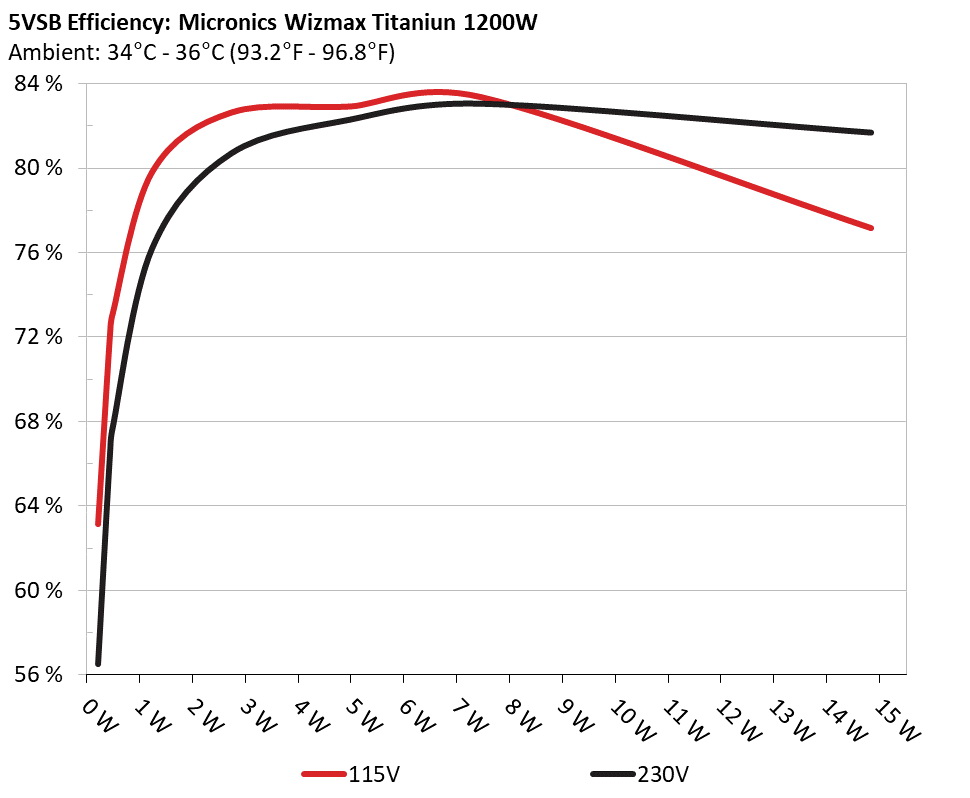
5VSB Efficiency
INFO
This graph depicts the efficiency levels of the 5VSB rail with 115V and 230V input


 Outside Validation Scope