Aristeidis Bitziopoulos, Certification Body General Manager
General Information
DUT Information
Brand
Gamer Storm
製造商 (OEM)
Helly
Series
PQ-P
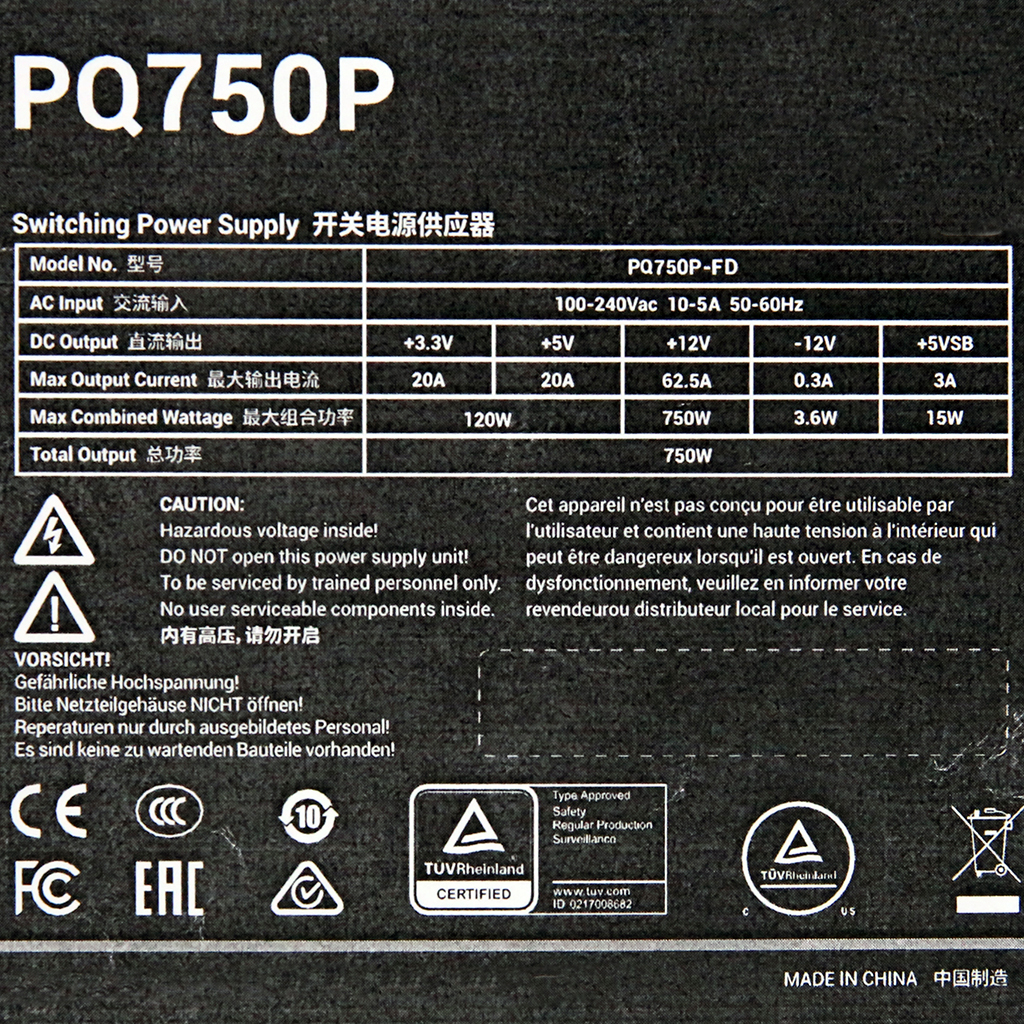
Model Number
PQ750-FD
Serial Number
DUT Notes
The unit could not operate again after OTP testing. In addition, during the 1kHz (180%) ATXv.3.x transient the PSU had to stop and restart in order to complete the test.
Cables and Connectors(Non-accredited measurements)
Modular Cables
Description
Cable Count
Connector Count (Total)
Gauge
In Cable Capacitors
ATX connector 20+4 pin (600mm)
1
1
16-22AWG
No
4+4 pin EPS12V (700mm)
2
2
16AWG
No
6+2 pin PCIe (600mm)
2
2
16AWG
No
12+4 pin PCIe (650mm) (600W)
1
1
16-24AWG
No
SATA (455mm+120mm+120mm+120mm)
1
4
18AWG
No
4-pin Molex (450mm+120mm+120mm+120mm)
1
4
18AWG
No
Test Results
Temperature & Compliance Info
Temperature Range (°C /°F)
30-32 / 86-89.6
ErP Lot 3/6 Ready
✓
(EU) No 617/2013 Compliance
✓
ALPM (Alternative Low Power Mode) compatible
✓
ATX v3.1 PSU Power Excursion
✓
Performance Summary
效率評比
PLATINUM
噪音評比
A-
Average Efficiency (>1450 load combinations)
90.214%
Average Noise Output (>1450 Load Combinations)
27.80dBA
Average PF (>1450 Load Combinations)
0.990
Efficiency With 10W (≤500W) or 2% (>500W) Load
70.499%
Standby Power Consumption
0.0498W
12V Ripple (Full Load)
34.30mV
5V Ripple (Full Load)
20.22mV
3.3V Ripple (Full Load)
19.03mV
5VSB Ripple (Full Load)
12.67mV
12V Load Regulation
0.15%
5V Load Regulation
0.49%
3.3V Load Regulation
0.91%
5VSB Load Regulation
3.60%
Inrush Current
23.390A
效率評比
PLATINUM
噪音評比
A-
Average Efficiency (>1450 load combinations)
92.153%
Average Noise Output (>1450 Load Combinations)
27.50dBA
Average PF (>1450 Load Combinations)
0.966
Efficiency With 10W (≤500W) or 2% (>500W) Load
69.746%
Standby Power Consumption
0.0843W
12V Ripple (Full Load)
34.97mV
5V Ripple (Full Load)
20.80mV
3.3V Ripple (Full Load)
19.73mV
5VSB Ripple (Full Load)
12.79mV
12V Load Regulation
0.16%
5V Load Regulation
0.51%
3.3V Load Regulation
0.91%
5VSB Load Regulation
3.56%
Inrush Current
46.480A
12V Transient Response (200%)
11.41V
5V Transient Response (200%)
4.964V
3.3V Transient Response (200%)
3.169V
5VSB Transient Response (200%)
4.965V
Hold-Up Time & Power Ok Signal
20.30ms
AC Loss to PWR_OK Hold Up Time
17.10ms
PWR_OK Inactive to DC Loss Delay
3.20ms
PSU Timings: T1 (20% / 100%)
59.0ms
59.0ms
PSU Timings: T3 (20% / 100%)
125.0ms
122.0ms
12V OCP (27.1°C / 43.8°C)
86.80A (138.88%), 11.993V
84.40A (135.04%), 12.005V
5V OCP (27.1°C / 43.8°C)
29.9A (149.50%), 5.072V
29.6A (148.00%), 5.073V
3.3V OCP (27.1°C / 43.8°C)
31A (155.00%), 3.281V
30.7A (153.50%), 3.283V
5VSB OCP (27.1°C / 43.8°C)
4.2A (140.00%), 5.017V
4.2A (140.00%), 5.009V
OPP (27.37°C / 42.29°C)
146.22%
141.55%
Hold-Up Time & Power Ok Signal
Hold-Up Time (ms)
20.3
AC Loss to PWR_OK Hold Up Time (ms)
17.1
PWR_OK Inactive to DC Loss Delay (ms)
3.2
待機電源消耗
Tables
Detailed Results
Average
Min
Limit Min
Max
Limit Max
Result
Mains Voltage RMS:
115.07 V
115.04 V
113.85 V
115.11 V
116.15 V
PASS
Mains Frequency:
60.00 Hz
59.99 Hz
59.40 Hz
60.01 Hz
60.60 Hz
PASS
Mains Voltage CF:
1.416
1.415
1.340
1.418
1.490
PASS
Mains Voltage THD:
0.13 %
0.09 %
N/A
0.18 %
2.00 %
PASS
Real Power:
0.050 W
-0.007 W
N/A
0.075 W
N/A
N/A
Apparent Power:
6.541 W
6.369 W
N/A
6.719 W
N/A
N/A
Power Factor:
0.007
N/A
N/A
N/A
N/A
N/A
Detailed Results
Average
Min
Limit Min
Max
Limit Max
Result
Mains Voltage RMS:
231.01 V
230.93 V
227.70 V
231.08 V
232.30 V
PASS
Mains Frequency:
50.00 Hz
49.99 Hz
49.50 Hz
50.01 Hz
50.50 Hz
PASS
Mains Voltage CF:
1.417
1.416
1.340
1.419
1.490
PASS
Mains Voltage THD:
0.17 %
0.15 %
N/A
0.24 %
2.00 %
PASS
Real Power:
0.084 W
0.056 W
N/A
0.128 W
N/A
N/A
Apparent Power:
21.722 W
21.442 W
N/A
22.022 W
N/A
N/A
Power Factor:
0.004
N/A
N/A
N/A
N/A
N/A
Graphs
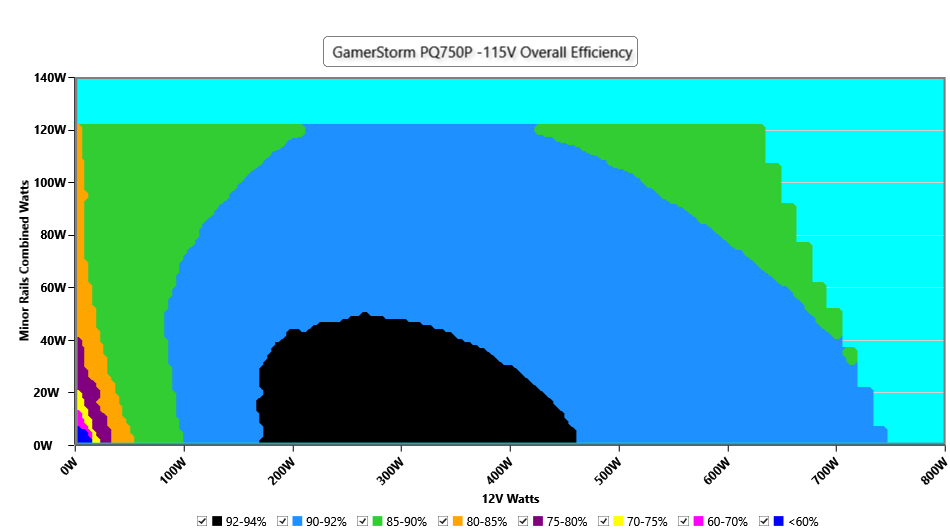
Efficiency Graph
INFO
This graph depicts the PSU`s efficiency throughout its entire operational range. For the generation of the efficiency and noise graphs we set our loaders to auto mode through our custom-made software before trying thousands of possible load combinations
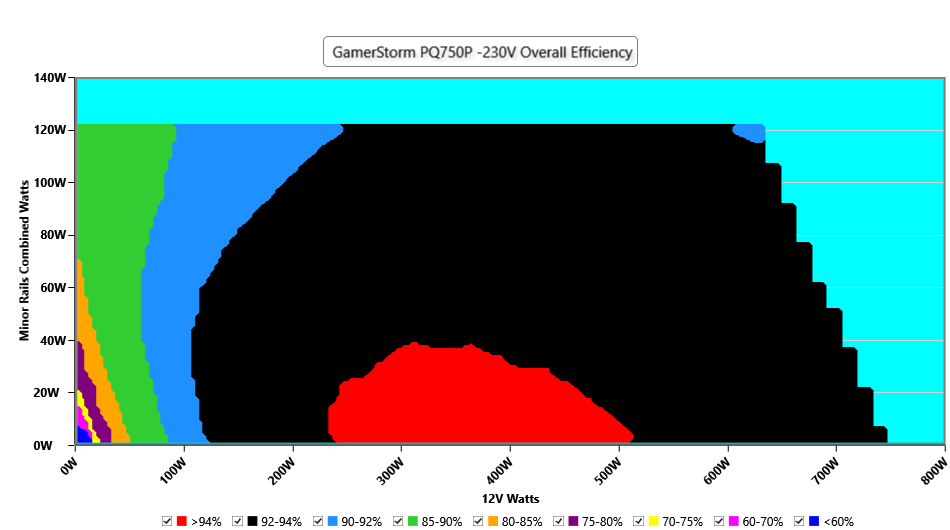
INFO
This graph depicts the PSU`s efficiency throughout its entire operational range. For the generation of the efficiency and noise graphs we set our loaders to auto mode through our custom-made software before trying thousands of possible load combinations
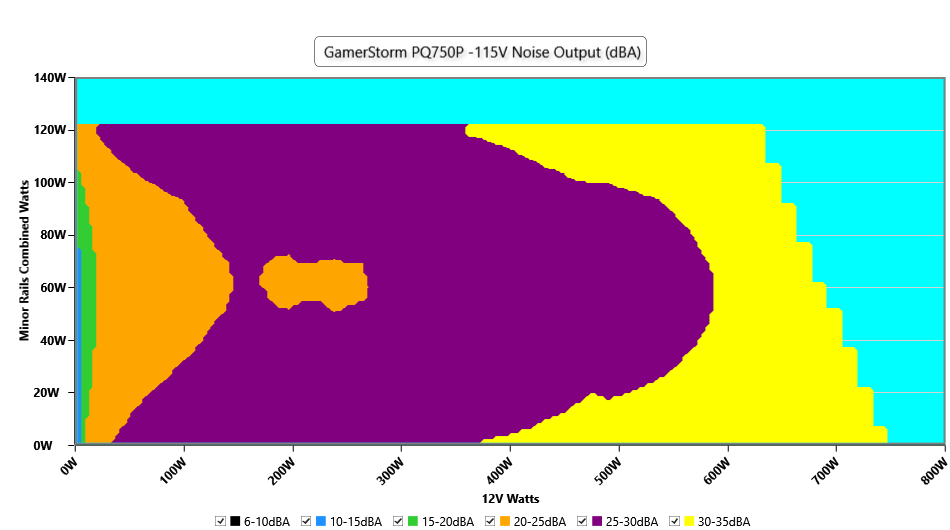
Noise Graph
INFO
The PSU`s noise in its entire operational range and under 30-32 °C ambient is depicted in this graph. The X axis represents the load on the +12V rail(s) while the Y axis is the load on the minor rails
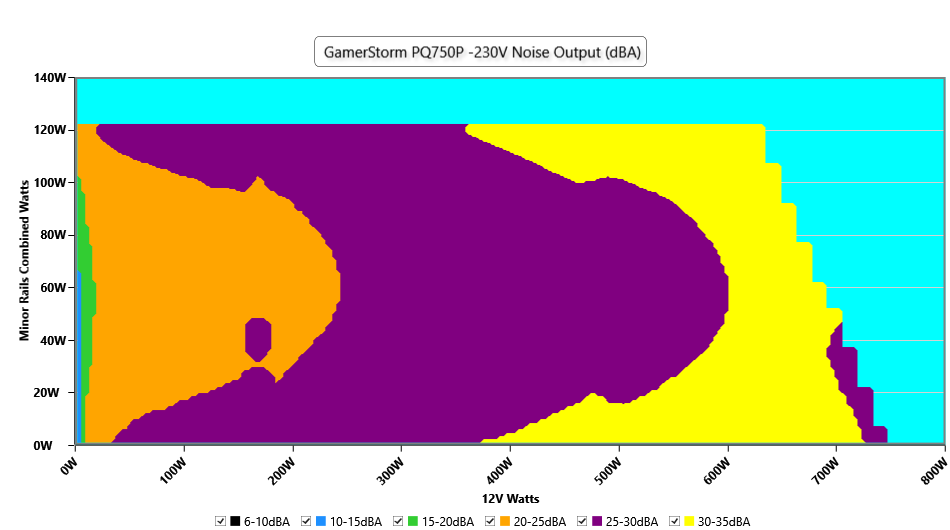
INFO
The PSU`s noise in its entire operational range and under 30-32 °C ambient is depicted in this graph. The X axis represents the load on the +12V rail(s) while the Y axis is the load on the minor rails
Conducted Emissions EN55032 & CISPR 32
Indicative Performance
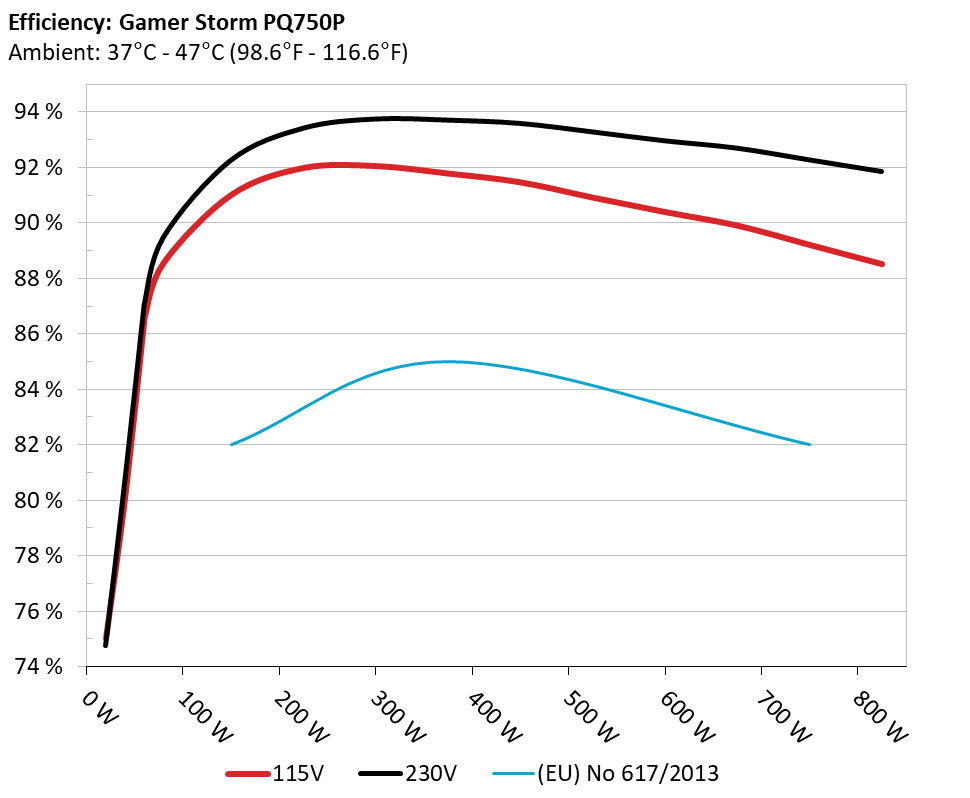
Efficiency under high ambient temperature
INFO
The PSU`s efficiency under high ambient temperatures with 115V and 230V input. For this graph the results of the 10-110% load regulation table are used
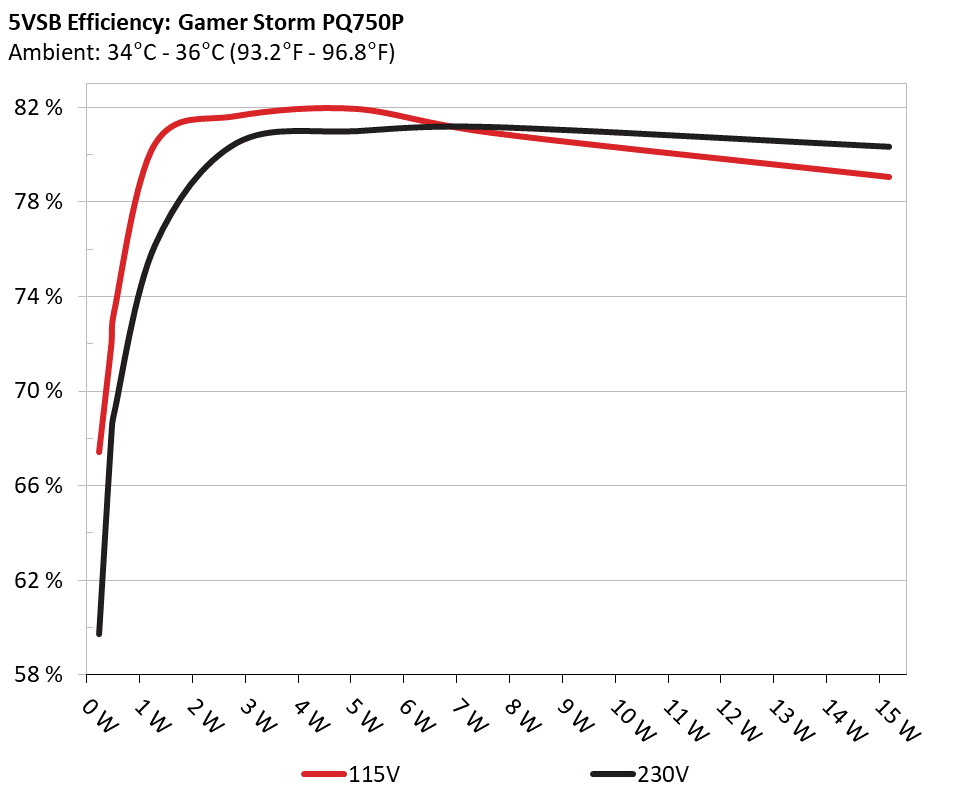
5VSB Efficiency
INFO
This graph depicts the efficiency levels of the 5VSB rail with 115V and 230V input


 Outside Validation Scope