Cables and Connectors(Non-accredited measurements)
Modular Cables
Description
Cable Count
Connector Count (Total)
Gauge
In Cable Capacitors
ATX connector 20+4 pin (655mm)
1
1
18AWG
No
4+4 pin EPS12V (650mm)
1
1
18AWG
No
8 pin EPS12V (650mm)
1
1
18AWG
No
6+2 pin PCIe (550mm)
3
3
16AWG
No
12+4 pin PCIe (650mm) (600W)
1
1
16-28AWG
No
SATA (500mm+120mm+120mm+120mm)
3
12
18AWG
No
4 pin Molex (500mm+120mm+120mm+120mm)
1
4
18AWG
No
AC Power Cord (1395mm) - C13 coupler
1
1
14AWG
-
Test Results
Temperature & Compliance Info
Temperature Range (°C /°F)
30-32 / 86-89.6
ErP Lot 3/6 Ready
✓
(EU) No 617/2013 Compliance
✓
ALPM (Alternative Low Power Mode) compatible
✓
ATX v3.1 PSU Power Excursion
✓
Performance Summary
Efficiency Rating
PLATINUM
Noise Rating
A
Average Efficiency (>1450 load combinations)
89.244%
Average Noise Output (>1450 Load Combinations)
24.89dBA
Average PF (>1450 Load Combinations)
0.986
Efficiency With 10W (≤500W) or 2% (>500W) Load
70.445%
Standby Power Consumption
0.0379W
12V Ripple (Full Load)
28.59mV
5V Ripple (Full Load)
14.91mV
3.3V Ripple (Full Load)
15.46mV
5VSB Ripple (Full Load)
13.11mV
12V Load Regulation
0.16%
5V Load Regulation
0.34%
3.3V Load Regulation
0.92%
5VSB Load Regulation
2.16%
Inrush Current
48.580A
Efficiency Rating
PLATINUM
Noise Rating
A
Average Efficiency (>1450 load combinations)
91.436%
Average Noise Output (>1450 Load Combinations)
24.80dBA
Average PF (>1450 Load Combinations)
0.964
Efficiency With 10W (≤500W) or 2% (>500W) Load
72.157%
Standby Power Consumption
0.0916W
12V Ripple (Full Load)
30.02mV
5V Ripple (Full Load)
14.35mV
3.3V Ripple (Full Load)
15.31mV
5VSB Ripple (Full Load)
13.58mV
12V Load Regulation
0.16%
5V Load Regulation
0.34%
3.3V Load Regulation
0.95%
5VSB Load Regulation
2.16%
Inrush Current
79.970A
12V Transient Response (200%)
11.36V
5V Transient Response (200%)
4.922V
3.3V Transient Response (200%)
3.190V
5VSB Transient Response (200%)
4.894V
Hold-Up Time & Power Ok Signal
30.30ms
AC Loss to PWR_OK Hold Up Time
27.20ms
PWR_OK Inactive to DC Loss Delay
3.10ms
PSU Timings: T1 (20% / 100%)
86.0ms
80.0ms
PSU Timings: T3 (20% / 100%)
131.0ms
132.0ms
12V OCP (27.5°C / 38.8°C)
100.60A (114.97%), 12.151V
-
5V OCP (27.5°C / 38.8°C)
25.2A (126.00%), 5.013V
24.6A (123.00%), 5.016V
3.3V OCP (27.5°C / 38.8°C)
25.0A (125.00%), 3.273V
24.6A (123.00%), 3.277V
5VSB OCP (27.5°C / 38.8°C)
6.8A (226.67%), 5.018V
6.8A (226.67%), 5.016V
OPP (27.42°C / 42.58°C)
126.57%
126.28%
Hold-Up Time & Power Ok Signal
Hold-Up Time (ms)
30.3
AC Loss to PWR_OK Hold Up Time (ms)
27.2
PWR_OK Inactive to DC Loss Delay (ms)
3.1
Vampire Power
Tables
Detailed Results
Average
Min
Limit Min
Max
Limit Max
Result
Mains Voltage RMS:
115.07 V
115.03 V
113.85 V
115.11 V
116.15 V
PASS
Mains Frequency:
60.00 Hz
59.99 Hz
59.40 Hz
60.01 Hz
60.60 Hz
PASS
Mains Voltage CF:
1.416
1.415
1.340
1.418
1.490
PASS
Mains Voltage THD:
0.13 %
0.09 %
N/A
0.19 %
2.00 %
PASS
Real Power:
0.038 W
-0.009 W
N/A
0.079 W
N/A
N/A
Apparent Power:
7.004 W
6.529 W
N/A
7.484 W
N/A
N/A
Power Factor:
0.008
N/A
N/A
N/A
N/A
N/A
Detailed Results
Average
Min
Limit Min
Max
Limit Max
Result
Mains Voltage RMS:
231.01 V
230.91 V
227.70 V
231.07 V
232.30 V
PASS
Mains Frequency:
50.00 Hz
49.99 Hz
49.50 Hz
50.01 Hz
50.50 Hz
PASS
Mains Voltage CF:
1.417
1.416
1.340
1.419
1.490
PASS
Mains Voltage THD:
0.17 %
0.14 %
N/A
0.27 %
2.00 %
PASS
Real Power:
0.092 W
0.051 W
N/A
0.146 W
N/A
N/A
Apparent Power:
21.866 W
21.330 W
N/A
22.477 W
N/A
N/A
Power Factor:
0.003
N/A
N/A
N/A
N/A
N/A
Graphs
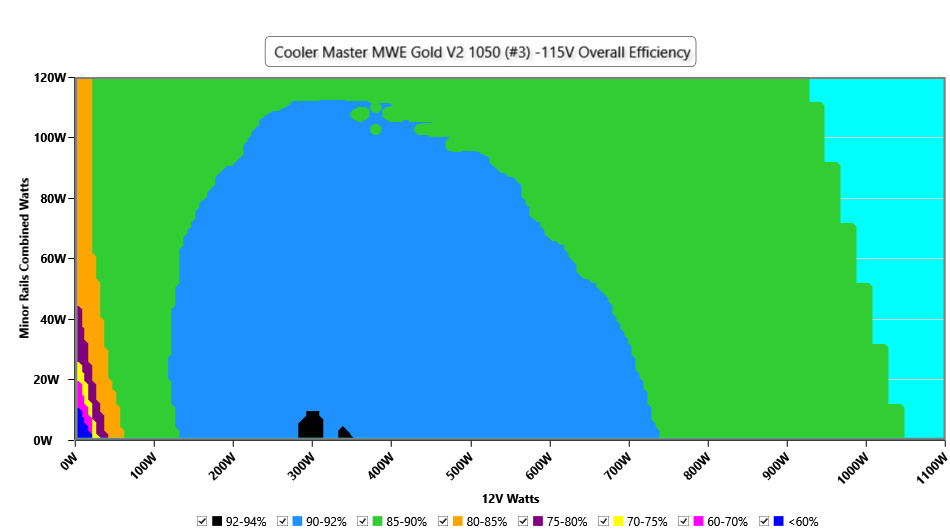
Efficiency Graph
INFO
This graph depicts the PSU`s efficiency throughout its entire operational range. For the generation of the efficiency and noise graphs we set our loaders to auto mode through our custom-made software before trying thousands of possible load combinations
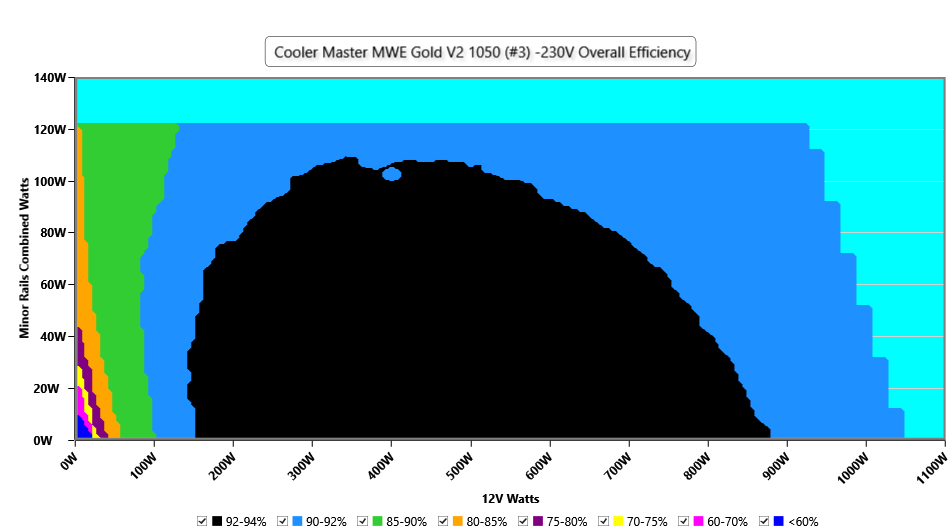
INFO
This graph depicts the PSU`s efficiency throughout its entire operational range. For the generation of the efficiency and noise graphs we set our loaders to auto mode through our custom-made software before trying thousands of possible load combinations
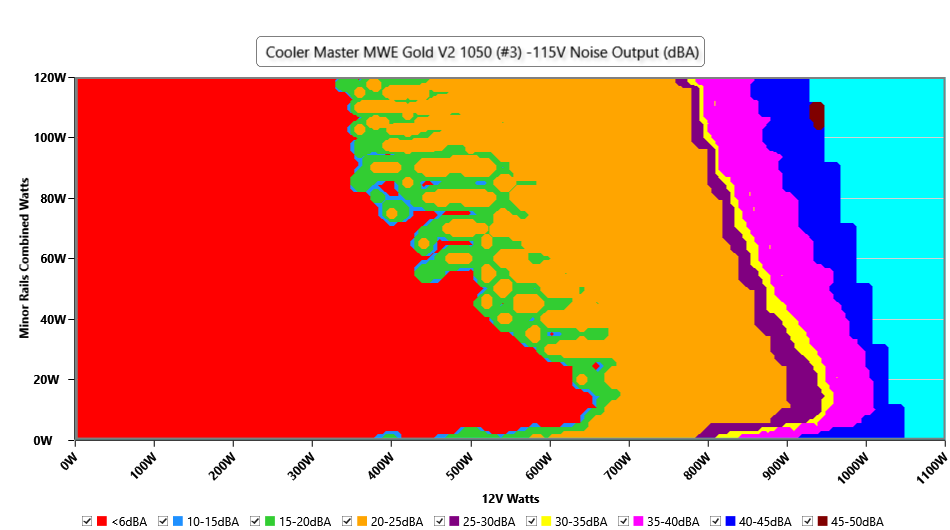
Noise Graph
INFO
The PSU`s noise in its entire operational range and under 30-32 °C ambient is depicted in this graph. The X axis represents the load on the +12V rail(s) while the Y axis is the load on the minor rails
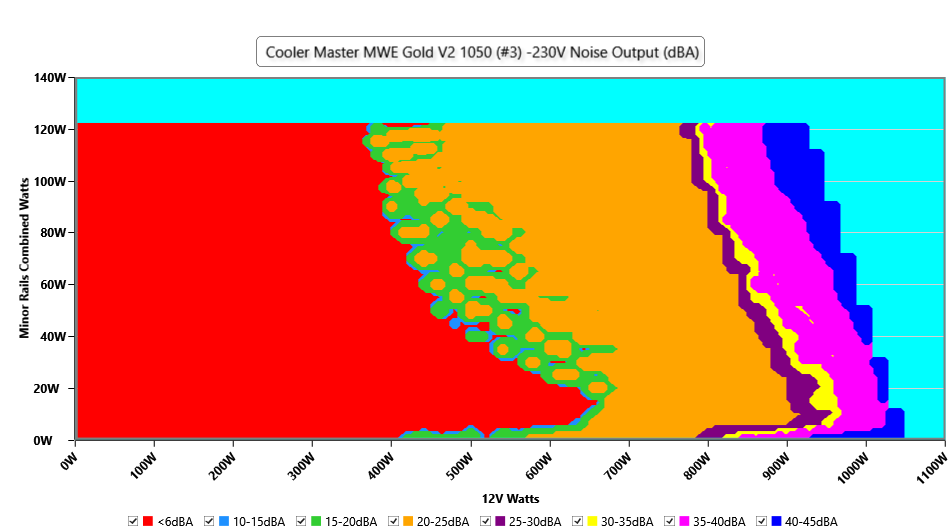
INFO
The PSU`s noise in its entire operational range and under 30-32 °C ambient is depicted in this graph. The X axis represents the load on the +12V rail(s) while the Y axis is the load on the minor rails
Conducted Emissions EN55032 & CISPR 32
Indicative Performance
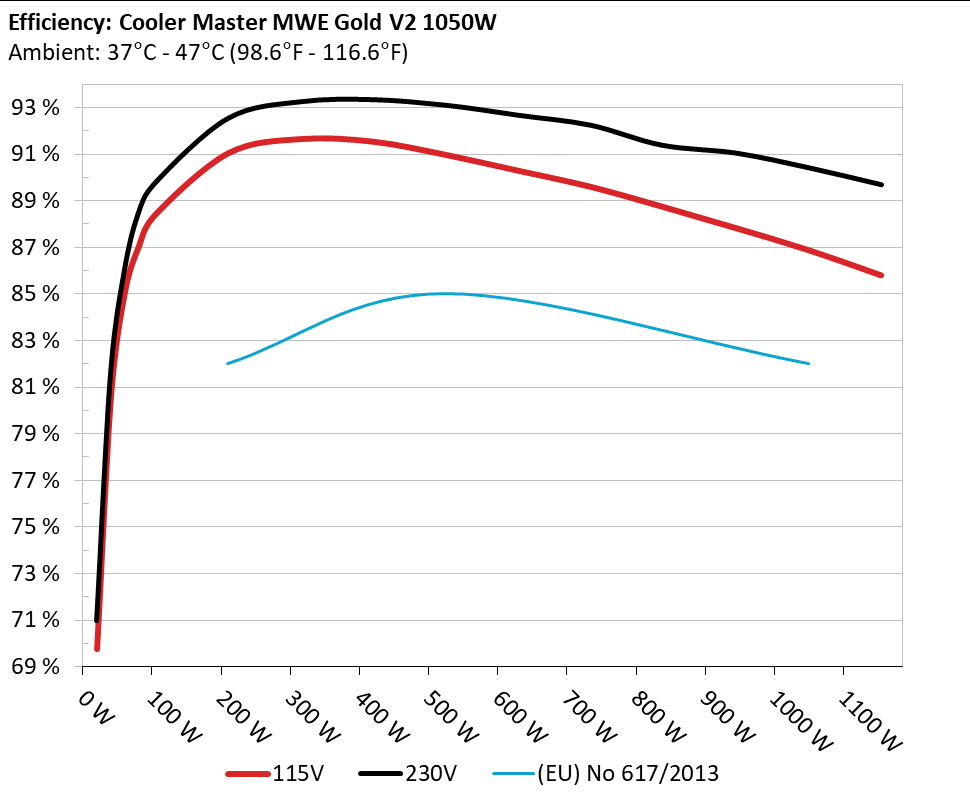
Efficiency under high ambient temperature
INFO
The PSU`s efficiency under high ambient temperatures with 115V and 230V input. For this graph the results of the 10-110% load regulation table are used
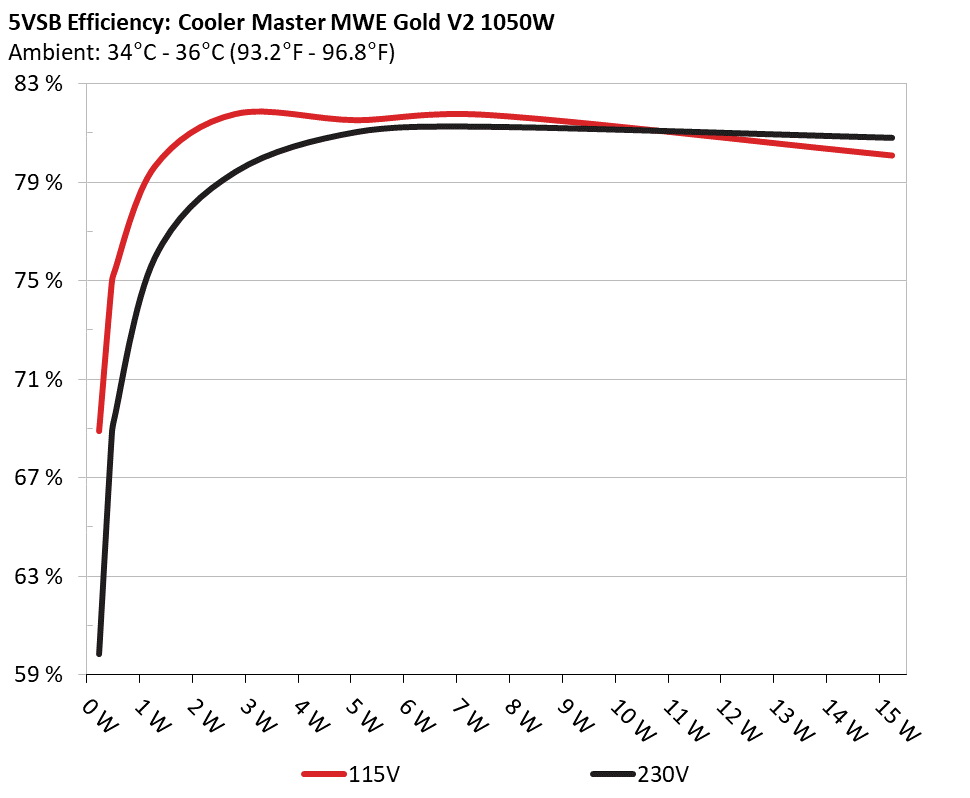
5VSB Efficiency
INFO
This graph depicts the efficiency levels of the 5VSB rail with 115V and 230V input
All data and graphs included in this test report can be used by any individual on the following conditions: › It should be mentioned that the test results are provided by Cybenetics › The link to the original test results document should be provided in any case
Cybenetics offers the ETA and Lambda voluntary certification programs, through which the efficient and silent power supplies are promoted


 Outside Validation Scope