Cables and Connectors(Non-accredited measurements)
Modular Cables
Description
Cable Count
Connector Count (Total)
Gauge
In Cable Capacitors
ATX connector 20+4 pin (605mm)
1
1
18-20AWG
No
4+4 pin EPS12V (650mm)
2
2
18AWG
No
6+2 pin PCIe (675mm)
1
1
18AWG
No
2 x 6+2 pin PCIe (675mm)
1
2
18AWG
No
12+4 pin PCIe (675mm) (600W)
1
1
16-24AWG
No
SATA (110mm+115mm+115mm+115mm)
1
4
18AWG
No
SATA (100mm+115mm+115mm+115mm)
1
4
18AWG
No
4-pin Molex (100mm+115mm+115mm+115mm)
1
4
18AWG
No
Test Results
Temperature & Compliance Info
Temperature Range (°C /°F)
30-32 / 86-89.6
ErP Lot 3/6 Ready
✓
(EU) No 617/2013 Compliance
✓
ALPM (Alternative Low Power Mode) compatible
✓
ATX v3.1 PSU Power Excursion
✓
Performance Summary
效率評比
GOLD
噪音評比
A
Average Efficiency (>1450 load combinations)
88.065%
Average Noise Output (>1450 Load Combinations)
20.87dBA
Average PF (>1450 Load Combinations)
0.990
Efficiency With 10W (≤500W) or 2% (>500W) Load
62.483%
Standby Power Consumption
0.0381W
12V Ripple (Full Load)
34.55mV
5V Ripple (Full Load)
18.82mV
3.3V Ripple (Full Load)
16.96mV
5VSB Ripple (Full Load)
17.64mV
12V Load Regulation
0.82%
5V Load Regulation
0.46%
3.3V Load Regulation
0.70%
5VSB Load Regulation
4.33%
Inrush Current
30.250A
效率評比
GOLD
噪音評比
A
Average Efficiency (>1450 load combinations)
90.281%
Average Noise Output (>1450 Load Combinations)
22.21dBA
Average PF (>1450 Load Combinations)
0.963
Efficiency With 10W (≤500W) or 2% (>500W) Load
61.633%
Standby Power Consumption
0.0955W
12V Ripple (Full Load)
33.58mV
5V Ripple (Full Load)
19.03mV
3.3V Ripple (Full Load)
18.73mV
5VSB Ripple (Full Load)
19.15mV
12V Load Regulation
0.82%
5V Load Regulation
0.44%
3.3V Load Regulation
0.73%
5VSB Load Regulation
4.46%
Inrush Current
63.150A
12V Transient Response (200%)
11.33V
5V Transient Response (200%)
4.907V
3.3V Transient Response (200%)
3.180V
5VSB Transient Response (200%)
4.942V
Hold-Up Time & Power Ok Signal
18.00ms
AC Loss to PWR_OK Hold Up Time
16.00ms
PWR_OK Inactive to DC Loss Delay
2.00ms
PSU Timings: T1 (20% / 100%)
48.0ms
47.0ms
PSU Timings: T3 (20% / 100%)
128.0ms
129.0ms
12V OCP (29.6°C / 41.2°C)
83.40A (134.52%), 12.028V
81.40A (131.29%), 12.032V
5V OCP (29.6°C / 41.2°C)
31.6A (126.40%), 4.996V
31.6A (126.40%), 5V
3.3V OCP (29.6°C / 41.2°C)
33.0A (132.00%), 3.273V
32.5A (130.00%), 3.276V
5VSB OCP (29.6°C / 41.2°C)
5.6A (186.67%), 4.904V
5.5A (183.33%), 4.903V
OPP (30.49°C / 42.88°C)
131.21%
128.76%
Hold-Up Time & Power Ok Signal
Hold-Up Time (ms)
18
AC Loss to PWR_OK Hold Up Time (ms)
16
PWR_OK Inactive to DC Loss Delay (ms)
2
待機電源消耗
Tables
Detailed Results
Average
Min
Limit Min
Max
Limit Max
Result
Mains Voltage RMS:
115.08 V
115.05 V
113.85 V
115.12 V
116.15 V
PASS
Mains Frequency:
60.00 Hz
59.99 Hz
59.40 Hz
60.01 Hz
60.60 Hz
PASS
Mains Voltage CF:
1.416
1.415
1.340
1.418
1.490
PASS
Mains Voltage THD:
0.13 %
0.09 %
N/A
0.18 %
2.00 %
PASS
Real Power:
0.038 W
-0.005 W
N/A
0.067 W
N/A
N/A
Apparent Power:
11.012 W
10.945 W
N/A
11.093 W
N/A
N/A
Power Factor:
0.005
N/A
N/A
N/A
N/A
N/A
Detailed Results
Average
Min
Limit Min
Max
Limit Max
Result
Mains Voltage RMS:
231.07 V
230.96 V
227.70 V
231.11 V
232.30 V
PASS
Mains Frequency:
50.00 Hz
49.99 Hz
49.50 Hz
50.01 Hz
50.50 Hz
PASS
Mains Voltage CF:
1.417
1.416
1.340
1.419
1.490
PASS
Mains Voltage THD:
0.17 %
0.15 %
N/A
0.24 %
2.00 %
PASS
Real Power:
0.096 W
0.060 W
N/A
0.152 W
N/A
N/A
Apparent Power:
37.874 W
37.637 W
N/A
38.161 W
N/A
N/A
Power Factor:
0.003
N/A
N/A
N/A
N/A
N/A
Graphs
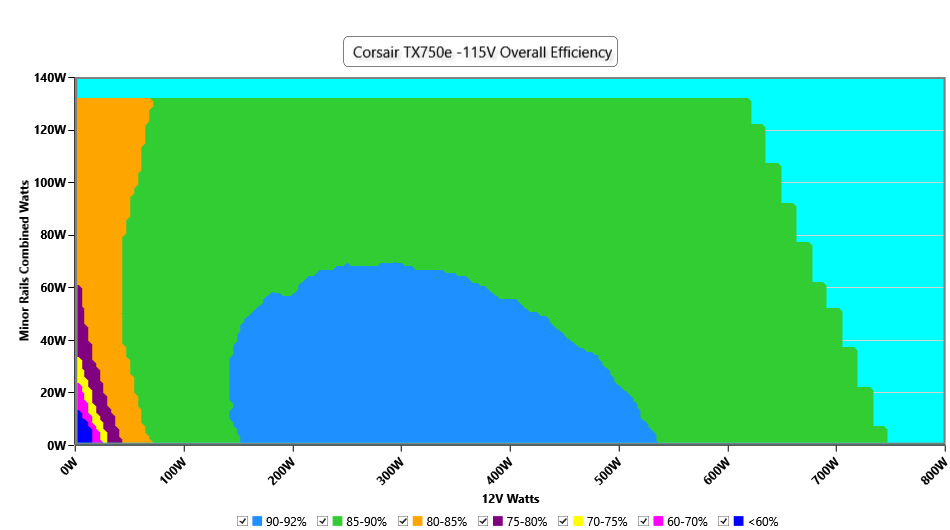
Efficiency Graph
INFO
This graph depicts the PSU`s efficiency throughout its entire operational range. For the generation of the efficiency and noise graphs we set our loaders to auto mode through our custom-made software before trying thousands of possible load combinations
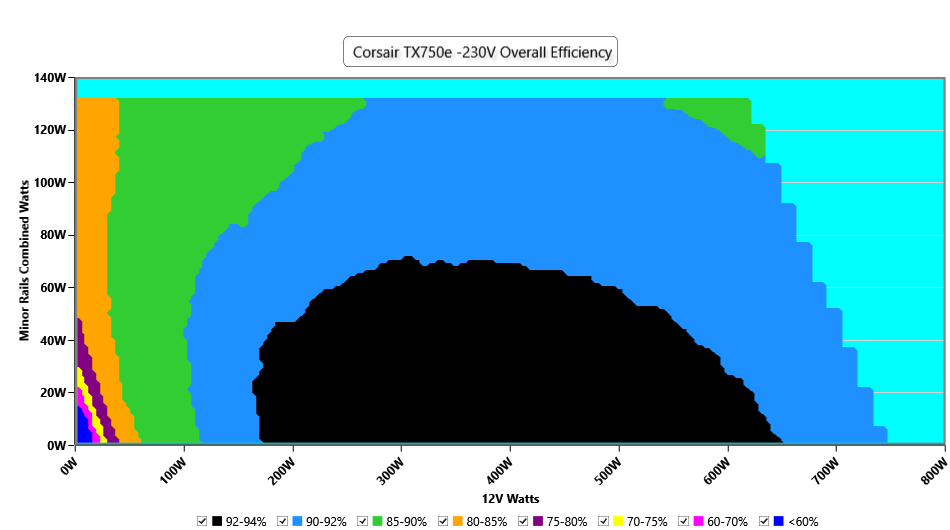
INFO
This graph depicts the PSU`s efficiency throughout its entire operational range. For the generation of the efficiency and noise graphs we set our loaders to auto mode through our custom-made software before trying thousands of possible load combinations
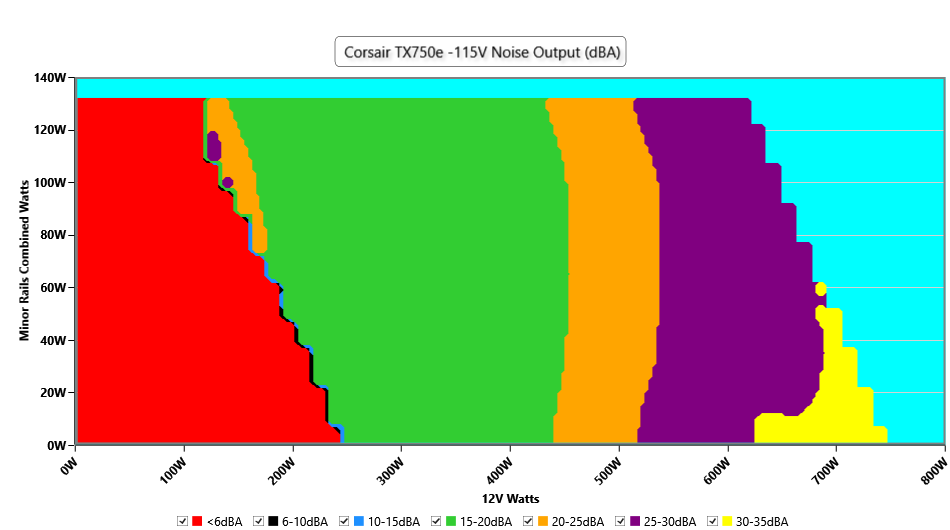
Noise Graph
INFO
The PSU`s noise in its entire operational range and under 30-32 °C ambient is depicted in this graph. The X axis represents the load on the +12V rail(s) while the Y axis is the load on the minor rails
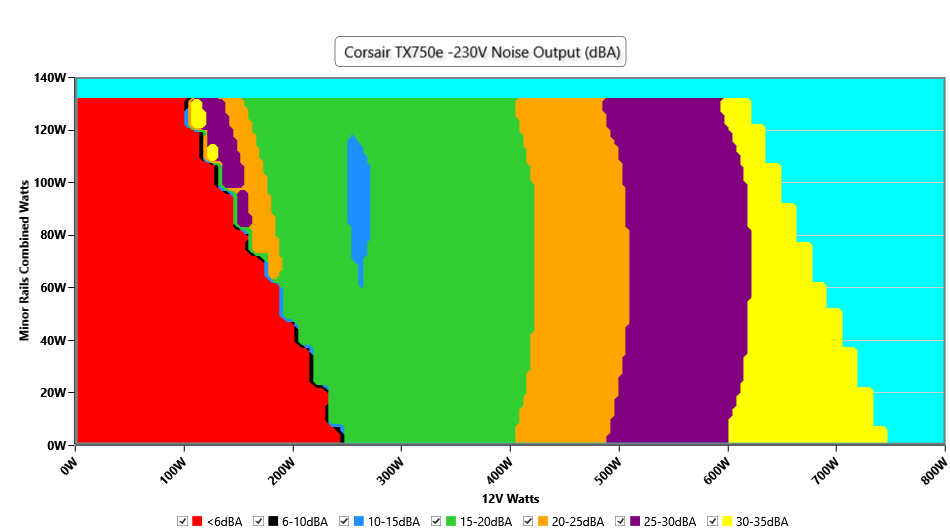
INFO
The PSU`s noise in its entire operational range and under 30-32 °C ambient is depicted in this graph. The X axis represents the load on the +12V rail(s) while the Y axis is the load on the minor rails
Conducted Emissions EN55032 & CISPR 32
Indicative Performance
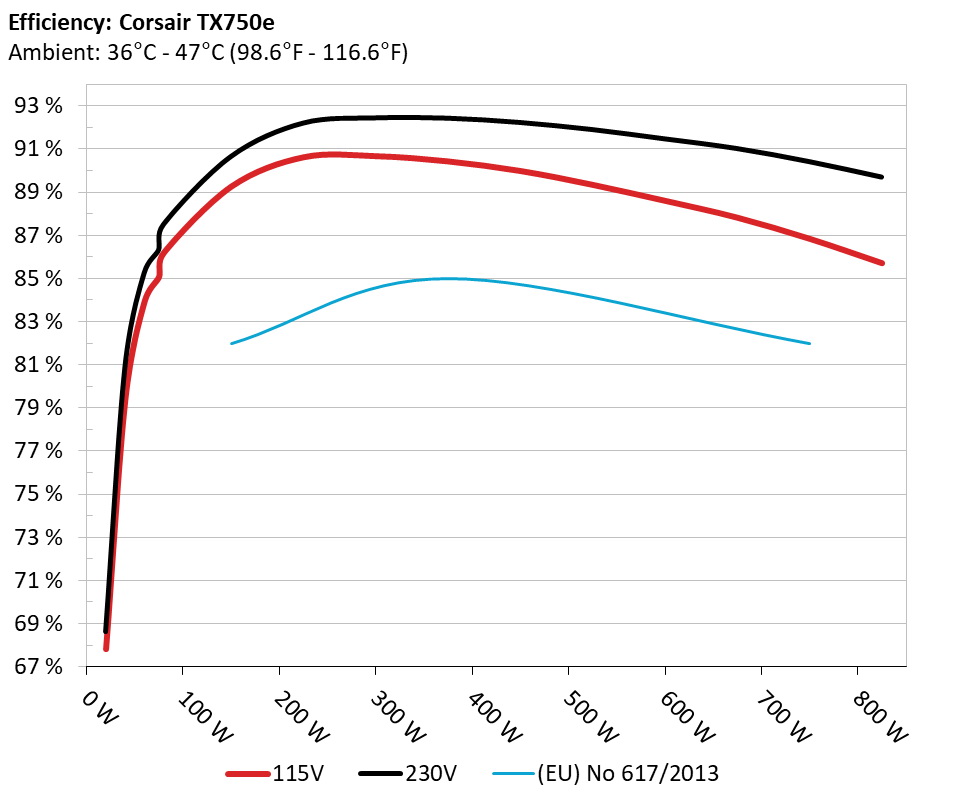
Efficiency under high ambient temperature
INFO
The PSU`s efficiency under high ambient temperatures with 115V and 230V input. For this graph the results of the 10-110% load regulation table are used
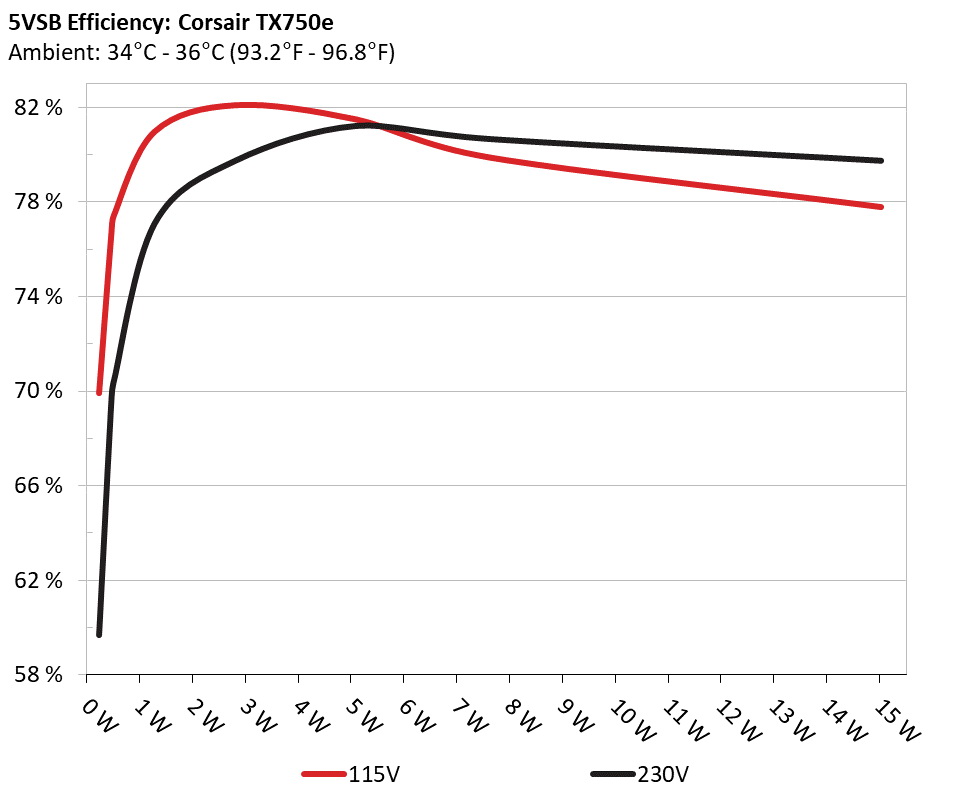
5VSB Efficiency
INFO
This graph depicts the efficiency levels of the 5VSB rail with 115V and 230V input


 Outside Validation Scope