Cables and Connectors(Non-accredited measurements)
Modular Cables
Description
Cable Count
Connector Count (Total)
Gauge
In Cable Capacitors
ATX connector 24 pin (590mm)
1
1
18AWG
No
4+4 pin EPS12V (600mm)
2
2
16AWG
No
6+2 pin PCIe (500mm+150mm)
2
4
18AWG
No
12+2 pin PCIe (595mm) (600W)
1
1
16-24AWG
No
SATA (400mm+150mm+150mm)
2
6
18AWG
No
4-pin Molex (400mm+150mm+150mm+150mm)
1
4
18AWG
No
FDD Adapter (+150mm)
1
1
18AWG
No
AC Power Cord (1350mm) - C13 coupler
1
1
18AWG
-
Test Results
Temperature & Compliance Info
Temperature Range (°C /°F)
30-32 / 86-89.6
ErP Lot 3/6 Ready
✓
(EU) No 617/2013 Compliance
✓
ALPM (Alternative Low Power Mode) compatible
✓
Performance Summary
效率評比
GOLD
噪音評比
Standard++
Average Efficiency (>1450 load combinations)
88.391%
Average Noise Output (>1450 Load Combinations)
30.50dBA
Average PF (>1450 Load Combinations)
0.979
Efficiency With 10W (≤500W) or 2% (>500W) Load
62.955%
Standby Power Consumption
0.0437W
12V Ripple (Full Load)
23.53mV
5V Ripple (Full Load)
11.82mV
3.3V Ripple (Full Load)
12.83mV
5VSB Ripple (Full Load)
13.36mV
12V Load Regulation
0.26%
5V Load Regulation
0.46%
3.3V Load Regulation
0.63%
5VSB Load Regulation
2.83%
Inrush Current
33.780A
效率評比
SILVER
噪音評比
Standard++
Average Efficiency (>1450 load combinations)
90.615%
Average Noise Output (>1450 Load Combinations)
30.91dBA
Average PF (>1450 Load Combinations)
0.927
Efficiency With 10W (≤500W) or 2% (>500W) Load
0.000%
Standby Power Consumption
0.1215W
12V Ripple (Full Load)
24.69mV
5V Ripple (Full Load)
12.07mV
3.3V Ripple (Full Load)
13.37mV
5VSB Ripple (Full Load)
12.59mV
12V Load Regulation
0.27%
5V Load Regulation
0.42%
3.3V Load Regulation
0.63%
5VSB Load Regulation
2.78%
Inrush Current
68.810A
12V Transient Response (200%)
11.46V
5V Transient Response (200%)
4.941V
3.3V Transient Response (200%)
3.253V
5VSB Transient Response (200%)
4.932V
Hold-Up Time & Power Ok Signal
15.70ms
AC Loss to PWR_OK Hold Up Time
14.50ms
PWR_OK Inactive to DC Loss Delay
1.20ms
PSU Timings: T1 (20% / 100%)
23.0ms
22.0ms
PSU Timings: T3 (20% / 100%)
112.0ms
113.0ms
12V OCP (28.5°C / 43.7°C)
76.40A (141.48%), 12.034V
70.60A (130.74%), 12.053V
5V OCP (28.5°C / 43.7°C)
28.4A (142.00%), 4.979V
28A (140.00%), 4.982V
3.3V OCP (28.5°C / 43.7°C)
29.6A (148.00%), 3.344V
29.6A (148.00%), 3.344V
5VSB OCP (28.5°C / 43.7°C)
3.9A (156.00%), 4.996V
3.9A (156.00%), 4.991V
OPP (29.50°C / 43.58°C)
137.09%
125.11%
Hold-Up Time & Power Ok Signal
Hold-Up Time (ms)
15.7
AC Loss to PWR_OK Hold Up Time (ms)
14.5
PWR_OK Inactive to DC Loss Delay (ms)
1.2
待機電源消耗
Tables
Detailed Results
Average
Min
Limit Min
Max
Limit Max
Result
Mains Voltage RMS:
114.87 V
114.81 V
113.85 V
114.93 V
116.15 V
PASS
Mains Frequency:
60.00 Hz
59.98 Hz
59.40 Hz
60.02 Hz
60.60 Hz
PASS
Mains Voltage CF:
1.419
1.417
1.340
1.422
1.490
PASS
Mains Voltage THD:
0.15 %
0.09 %
N/A
0.27 %
2.00 %
PASS
Real Power:
0.044 W
0.015 W
N/A
0.064 W
N/A
N/A
Apparent Power:
10.245 W
10.227 W
N/A
10.264 W
N/A
N/A
Power Factor:
0.005
N/A
N/A
N/A
N/A
N/A
Detailed Results
Average
Min
Limit Min
Max
Limit Max
Result
Mains Voltage RMS:
229.95 V
229.87 V
227.70 V
230.02 V
232.30 V
PASS
Mains Frequency:
50.00 Hz
49.99 Hz
49.50 Hz
50.01 Hz
50.50 Hz
PASS
Mains Voltage CF:
1.417
1.416
1.340
1.419
1.490
PASS
Mains Voltage THD:
0.17 %
0.13 %
N/A
0.22 %
2.00 %
PASS
Real Power:
0.122 W
0.104 W
N/A
0.148 W
N/A
N/A
Apparent Power:
34.575 W
34.544 W
N/A
34.602 W
N/A
N/A
Power Factor:
0.003
N/A
N/A
N/A
N/A
N/A
Graphs
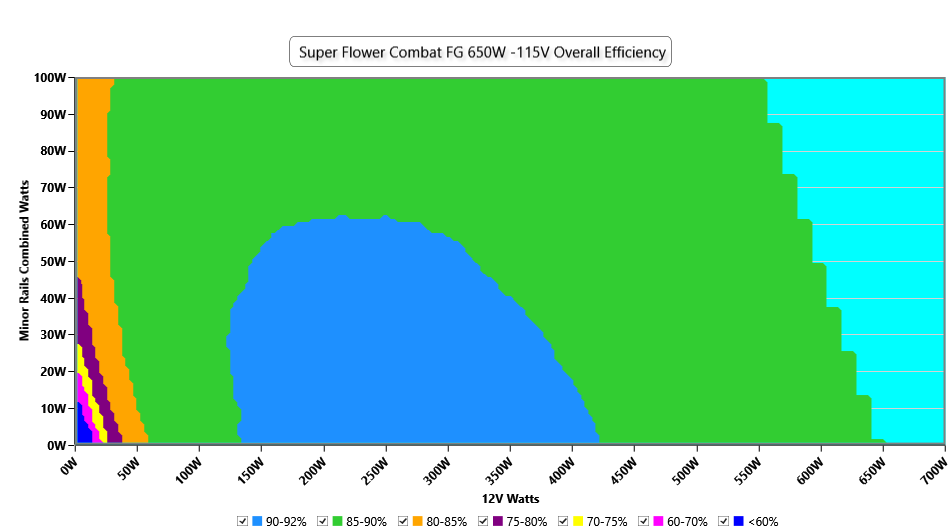
Efficiency Graph
INFO
This graph depicts the PSU`s efficiency throughout its entire operational range. For the generation of the efficiency and noise graphs we set our loaders to auto mode through our custom-made software before trying thousands of possible load combinations
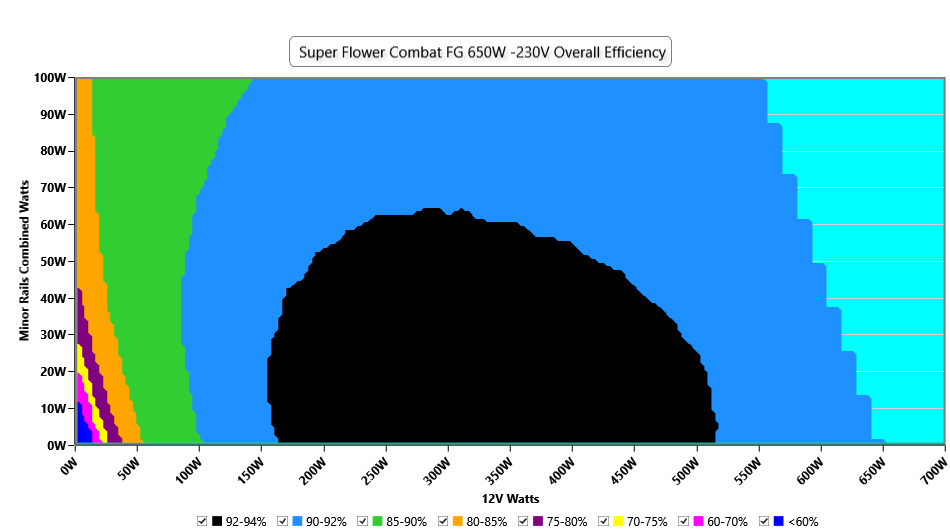
INFO
This graph depicts the PSU`s efficiency throughout its entire operational range. For the generation of the efficiency and noise graphs we set our loaders to auto mode through our custom-made software before trying thousands of possible load combinations
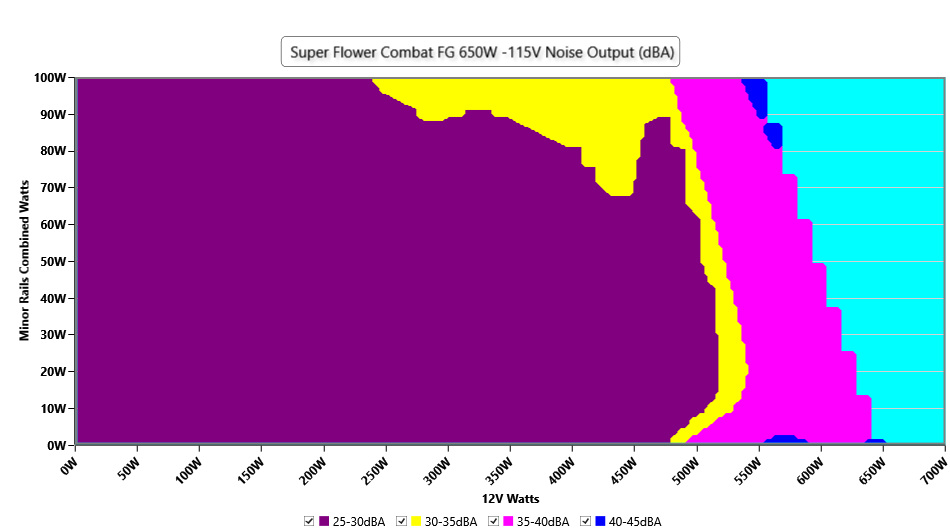
Noise Graph
INFO
The PSU`s noise in its entire operational range and under 30-32 °C ambient is depicted in this graph. The X axis represents the load on the +12V rail(s) while the Y axis is the load on the minor rails
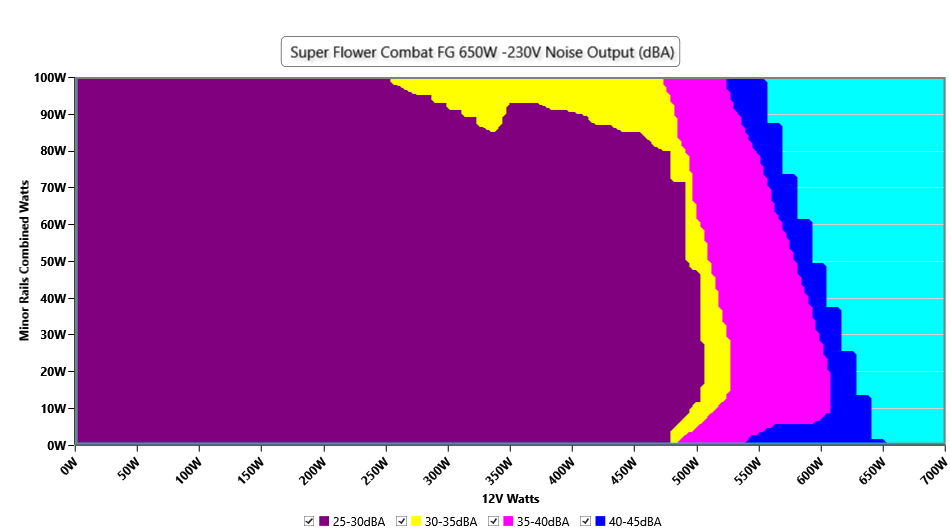
INFO
The PSU`s noise in its entire operational range and under 30-32 °C ambient is depicted in this graph. The X axis represents the load on the +12V rail(s) while the Y axis is the load on the minor rails
Conducted Emissions EN55032 & CISPR 32
Indicative Performance
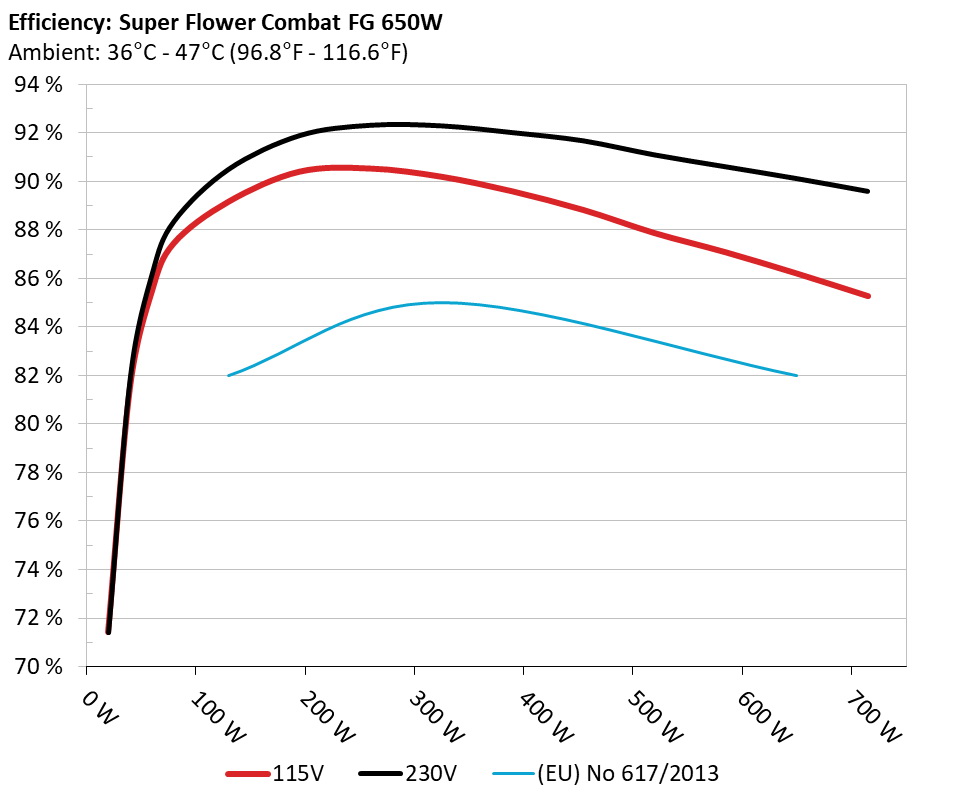
Efficiency under high ambient temperature
INFO
The PSU`s efficiency under high ambient temperatures with 115V and 230V input. For this graph the results of the 10-110% load regulation table are used
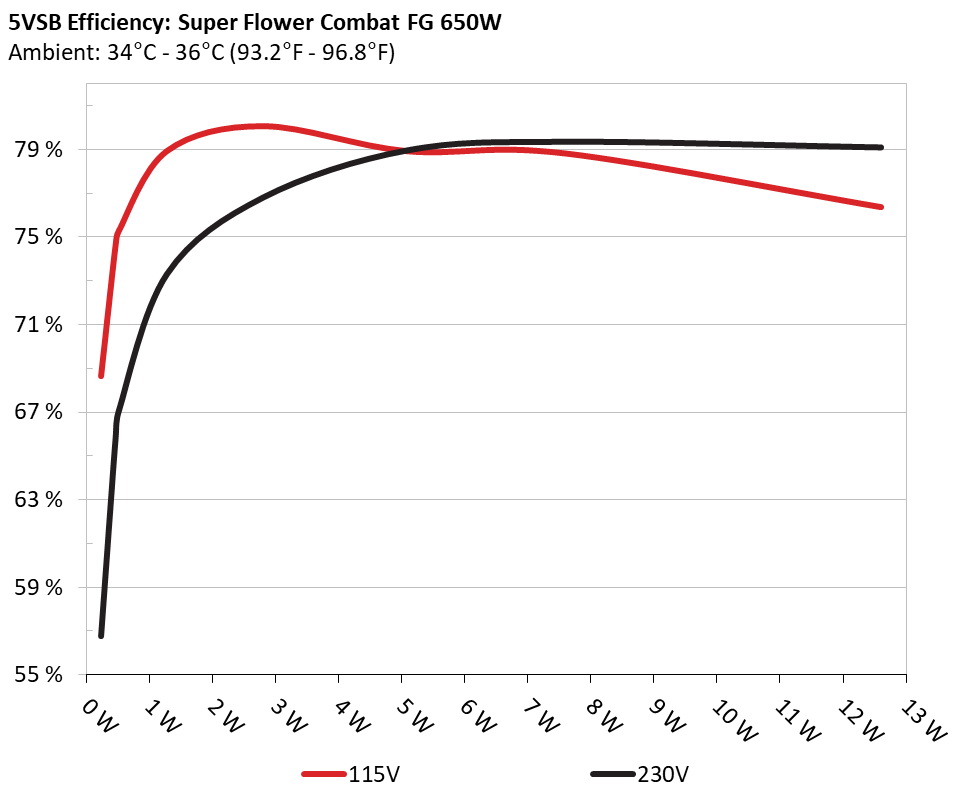
5VSB Efficiency
INFO
This graph depicts the efficiency levels of the 5VSB rail with 115V and 230V input