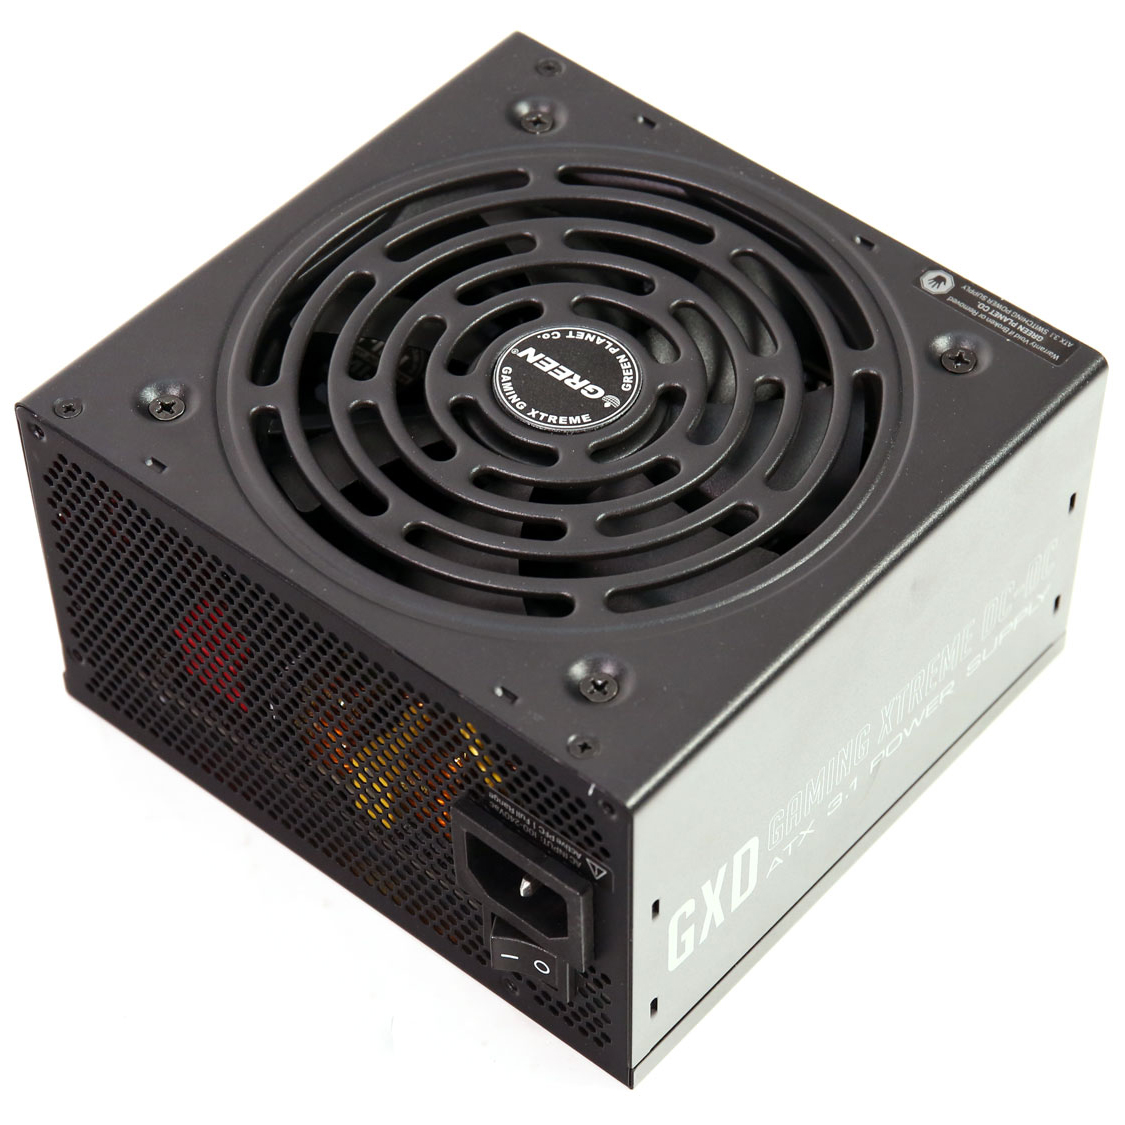
Cables and Connectors(Non-accredited measurements)
Modular Cables
Description
Cable Count
Connector Count (Total)
Gauge
In Cable Capacitors
ATX connector 20+4 pin (600mm)
1
1
16-22AWG
No
4+4 pin EPS12V (700mm)
2
2
18AWG
No
6+2 pin PCIe (550mm+150mm)
2
4
16-18AWG
No
6+2 pin PCIe (550mm)
1
1
16AWG
No
12+4 pin PCIe (550mm) (600W)
1
1
16-26AWG
No
SATA (505mm+145mm+145mm+145mm)
3
12
18AWG
No
4-pin Molex (500mm+150mm+150mm)
1
3
18AWG
No
AC Power Cord (1350mm) - C13 coupler
1
1
16AWG
-
Test Results
Temperature & Compliance Info
Temperature Range (°C /°F)
30-32 / 86-89.6
ErP Lot 3/6 Ready
✓
(EU) No 617/2013 Compliance
✓
ALPM (Alternative Low Power Mode) compatible
✓
ATX v3.1 PSU Power Excursion
✓
Performance Summary
Wirkungsgrad
GOLD
Lautstärkeklasse
Standard++
Average Efficiency (>1450 load combinations)
88.813%
Average Noise Output (>1450 Load Combinations)
30.99dBA
Average PF (>1450 Load Combinations)
0.989
Efficiency With 10W (≤500W) or 2% (>500W) Load
61.116%
Standby Power Consumption
0.0615W
12V Ripple (Full Load)
43.92mV
5V Ripple (Full Load)
18.62mV
3.3V Ripple (Full Load)
29.37mV
5VSB Ripple (Full Load)
14.87mV
12V Load Regulation
0.76%
5V Load Regulation
0.57%
3.3V Load Regulation
0.60%
5VSB Load Regulation
2.05%
Inrush Current
53.800A
Wirkungsgrad
PLATINUM
Lautstärkeklasse
Standard++
Average Efficiency (>1450 load combinations)
91.193%
Average Noise Output (>1450 Load Combinations)
30.56dBA
Average PF (>1450 Load Combinations)
0.955
Efficiency With 10W (≤500W) or 2% (>500W) Load
60.512%
Standby Power Consumption
0.1656W
12V Ripple (Full Load)
27.92mV
5V Ripple (Full Load)
17.55mV
3.3V Ripple (Full Load)
28.58mV
5VSB Ripple (Full Load)
12.73mV
12V Load Regulation
0.74%
5V Load Regulation
0.57%
3.3V Load Regulation
0.57%
5VSB Load Regulation
2.05%
Inrush Current
66.900A
12V Transient Response (200%)
11.42V
5V Transient Response (200%)
4.995V
3.3V Transient Response (200%)
3.234V
5VSB Transient Response (200%)
4.976V
Hold-Up Time & Power Ok Signal
18.20ms
AC Loss to PWR_OK Hold Up Time
16.70ms
PWR_OK Inactive to DC Loss Delay
1.50ms
PSU Timings: T1 (20% / 100%)
95.0ms
94.0ms
PSU Timings: T3 (20% / 100%)
121.0ms
121.0ms
12V OCP (29.7°C / 43.2°C)
118.60A (142.38%), 12.011V
117.00A (140.46%), 12.022V
5V OCP (29.7°C / 43.2°C)
30.3A (137.73%), 5.022V
28.6A (130.00%), 5.033V
3.3V OCP (29.7°C / 43.2°C)
29.6A (134.55%), 3.332V
29.5A (134.09%), 3.332V
5VSB OCP (29.7°C / 43.2°C)
3.9A (130.00%), 5.07V
3.8A (126.67%), 5.068V
OPP (30.28°C / 43.21°C)
142.51%
124.27%
Hold-Up Time & Power Ok Signal
Hold-Up Time (ms)
18.2
AC Loss to PWR_OK Hold Up Time (ms)
16.7
PWR_OK Inactive to DC Loss Delay (ms)
1.5
Stromverbrauch im Ruhezustand
Tables
Detailed Results
Average
Min
Limit Min
Max
Limit Max
Result
Mains Voltage RMS:
115.05 V
115.02 V
113.85 V
115.10 V
116.15 V
PASS
Mains Frequency:
60.00 Hz
59.96 Hz
59.40 Hz
60.02 Hz
60.60 Hz
PASS
Mains Voltage CF:
1.416
1.416
1.340
1.418
1.490
PASS
Mains Voltage THD:
0.14 %
0.11 %
N/A
0.20 %
2.00 %
PASS
Real Power:
0.062 W
0.008 W
N/A
0.101 W
N/A
N/A
Apparent Power:
8.750 W
8.635 W
N/A
8.879 W
N/A
N/A
Power Factor:
0.007
N/A
N/A
N/A
N/A
N/A
Detailed Results
Average
Min
Limit Min
Max
Limit Max
Result
Mains Voltage RMS:
231.01 V
230.92 V
227.70 V
231.07 V
232.30 V
PASS
Mains Frequency:
50.00 Hz
49.99 Hz
49.50 Hz
50.01 Hz
50.50 Hz
PASS
Mains Voltage CF:
1.417
1.416
1.340
1.419
1.490
PASS
Mains Voltage THD:
0.17 %
0.14 %
N/A
0.24 %
2.00 %
PASS
Real Power:
0.166 W
0.125 W
N/A
0.218 W
N/A
N/A
Apparent Power:
29.407 W
29.173 W
N/A
29.705 W
N/A
N/A
Power Factor:
0.006
N/A
N/A
N/A
N/A
N/A
Graphs
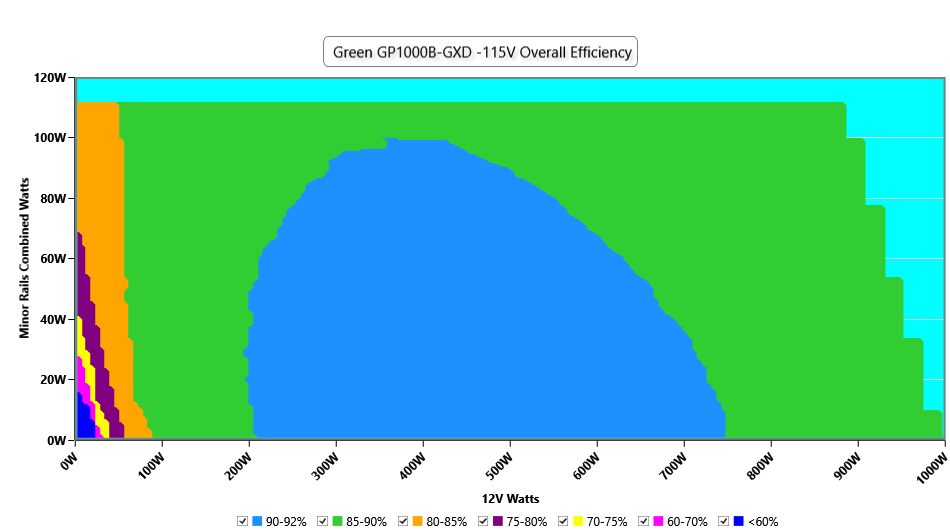
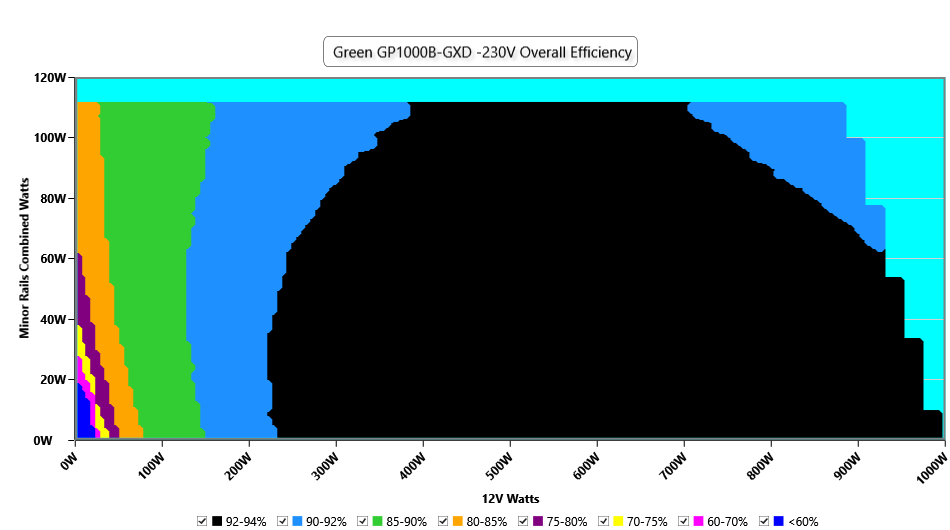
Efficiency Graph
INFO
This graph depicts the PSU`s efficiency throughout its entire operational range. For the generation of the efficiency and noise graphs we set our loaders to auto mode through our custom-made software before trying thousands of possible load combinations
INFO
This graph depicts the PSU`s efficiency throughout its entire operational range. For the generation of the efficiency and noise graphs we set our loaders to auto mode through our custom-made software before trying thousands of possible load combinations
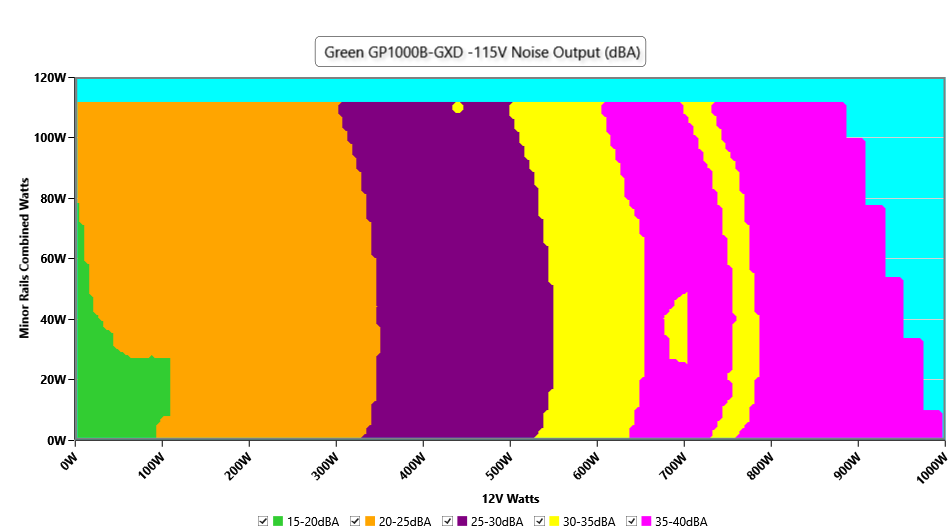
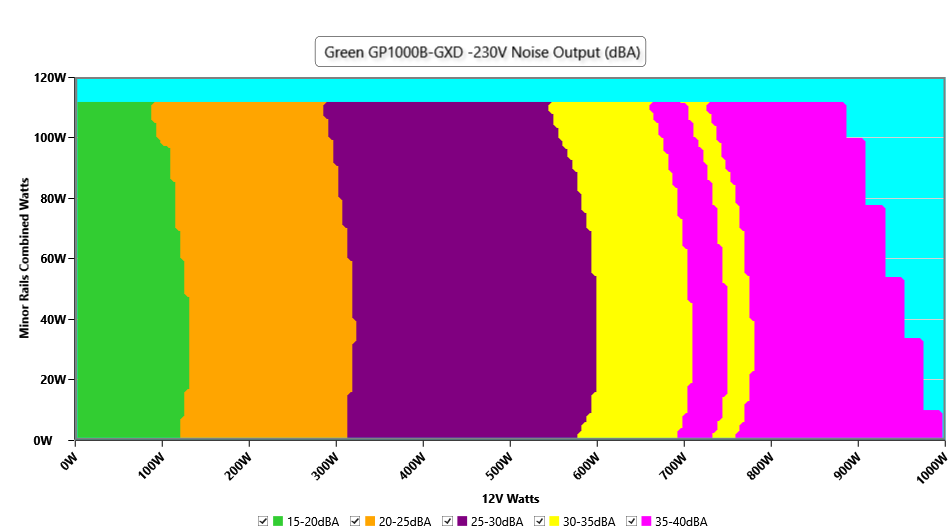
Noise Graph
INFO
The PSU`s noise in its entire operational range and under 30-32 °C ambient is depicted in this graph. The X axis represents the load on the +12V rail(s) while the Y axis is the load on the minor rails
INFO
The PSU`s noise in its entire operational range and under 30-32 °C ambient is depicted in this graph. The X axis represents the load on the +12V rail(s) while the Y axis is the load on the minor rails


 Outside Validation Scope