Cables and Connectors(Non-accredited measurements)
Modular Cables
Description
Cable Count
Connector Count (Total)
Gauge
In Cable Capacitors
ATX connector 20+4 pin (590mm)
1
1
18AWG
No
4+4 pin EPS12V (700mm)
2
2
18AWG
No
6+2 pin PCIe (600mm+150mm)
2
4
18AWG
No
12+4 pin PCIe (600mm) (600W)
1
1
16-26AWG
No
SATA (500mm+150mm+150mm+150mm)
2
8
18AWG
No
4-pin Molex (500mm+150mm+150mm+150mm)
1
4
18AWG
No
AC Power Cord (1350mm) - C13 coupler
1
1
18AWG
-
Test Results
Temperature & Compliance Info
Temperature Range (°C /°F)
30-32 / 86-89.6
ErP Lot 3/6 Ready
✓
(EU) No 617/2013 Compliance
✓
ALPM (Alternative Low Power Mode) compatible
✓
ATX v3.1 PSU Power Excursion
✓
Performance Summary
效率評比
PLATINUM
噪音評比
A-
Average Efficiency (>1450 load combinations)
89.800%
Average Noise Output (>1450 Load Combinations)
26.89dBA
Average PF (>1450 Load Combinations)
0.985
Efficiency With 10W (≤500W) or 2% (>500W) Load
70.357%
Standby Power Consumption
0.0730W
12V Ripple (Full Load)
28.25mV
5V Ripple (Full Load)
22.96mV
3.3V Ripple (Full Load)
20.83mV
5VSB Ripple (Full Load)
17.02mV
12V Load Regulation
0.39%
5V Load Regulation
0.32%
3.3V Load Regulation
0.42%
5VSB Load Regulation
4.89%
Inrush Current
16.852A
效率評比
PLATINUM
噪音評比
A-
Average Efficiency (>1450 load combinations)
91.840%
Average Noise Output (>1450 Load Combinations)
26.26dBA
Average PF (>1450 Load Combinations)
0.945
Efficiency With 10W (≤500W) or 2% (>500W) Load
70.828%
Standby Power Consumption
0.1474W
12V Ripple (Full Load)
29.21mV
5V Ripple (Full Load)
22.60mV
3.3V Ripple (Full Load)
22.19mV
5VSB Ripple (Full Load)
16.24mV
12V Load Regulation
0.27%
5V Load Regulation
0.30%
3.3V Load Regulation
0.45%
5VSB Load Regulation
4.87%
Inrush Current
33.540A
12V Transient Response (200%)
11.37V
5V Transient Response (200%)
4.912V
3.3V Transient Response (200%)
3.245V
5VSB Transient Response (200%)
4.956V
Hold-Up Time & Power Ok Signal
22.40ms
AC Loss to PWR_OK Hold Up Time
14.30ms
PWR_OK Inactive to DC Loss Delay
8.10ms
PSU Timings: T1 (20% / 100%)
75.0ms
69.0ms
PSU Timings: T3 (20% / 100%)
117.0ms
117.0ms
12V OCP (25.8°C / 40.7°C)
92.80A (131.07%), 11.960V
92.80A (131.07%), 11.976V
5V OCP (25.8°C / 40.7°C)
24.9A (124.50%), 4.998V
26.1A (130.50%), 5.002V
3.3V OCP (25.8°C / 40.7°C)
31.4A (157.00%), 3.342V
30A (150.00%), 3.343V
5VSB OCP (25.8°C / 40.7°C)
4.9A (163.33%), 4.872V
4.7A (156.67%), 4.874V
OPP (27.07°C / 42.17°C)
128.84%
123.25%
Hold-Up Time & Power Ok Signal
Hold-Up Time (ms)
22.4
AC Loss to PWR_OK Hold Up Time (ms)
14.3
PWR_OK Inactive to DC Loss Delay (ms)
8.1
待機電源消耗
Tables
Detailed Results
Average
Min
Limit Min
Max
Limit Max
Result
Mains Voltage RMS:
115.06 V
115.02 V
113.85 V
115.10 V
116.15 V
PASS
Mains Frequency:
60.00 Hz
59.99 Hz
59.40 Hz
60.01 Hz
60.60 Hz
PASS
Mains Voltage CF:
1.416
1.415
1.340
1.418
1.490
PASS
Mains Voltage THD:
0.13 %
0.09 %
N/A
0.18 %
2.00 %
PASS
Real Power:
0.073 W
0.004 W
N/A
0.106 W
N/A
N/A
Apparent Power:
10.040 W
9.965 W
N/A
10.105 W
N/A
N/A
Power Factor:
0.008
N/A
N/A
N/A
N/A
N/A
Detailed Results
Average
Min
Limit Min
Max
Limit Max
Result
Mains Voltage RMS:
231.01 V
230.92 V
227.70 V
231.08 V
232.30 V
PASS
Mains Frequency:
50.00 Hz
49.99 Hz
49.50 Hz
50.01 Hz
50.50 Hz
PASS
Mains Voltage CF:
1.417
1.416
1.340
1.419
1.490
PASS
Mains Voltage THD:
0.17 %
0.14 %
N/A
0.26 %
2.00 %
PASS
Real Power:
0.147 W
0.112 W
N/A
0.197 W
N/A
N/A
Apparent Power:
34.149 W
33.961 W
N/A
34.382 W
N/A
N/A
Power Factor:
0.005
N/A
N/A
N/A
N/A
N/A
Graphs
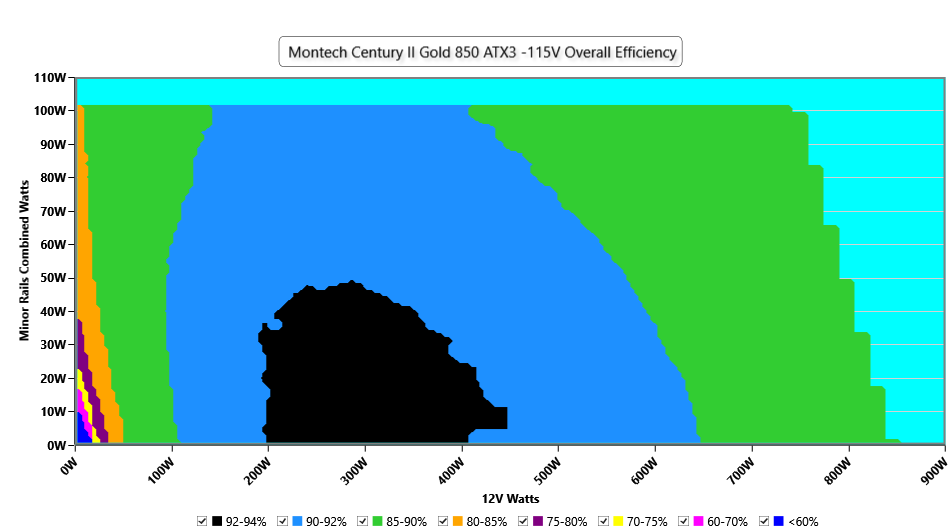
Efficiency Graph
INFO
This graph depicts the PSU`s efficiency throughout its entire operational range. For the generation of the efficiency and noise graphs we set our loaders to auto mode through our custom-made software before trying thousands of possible load combinations
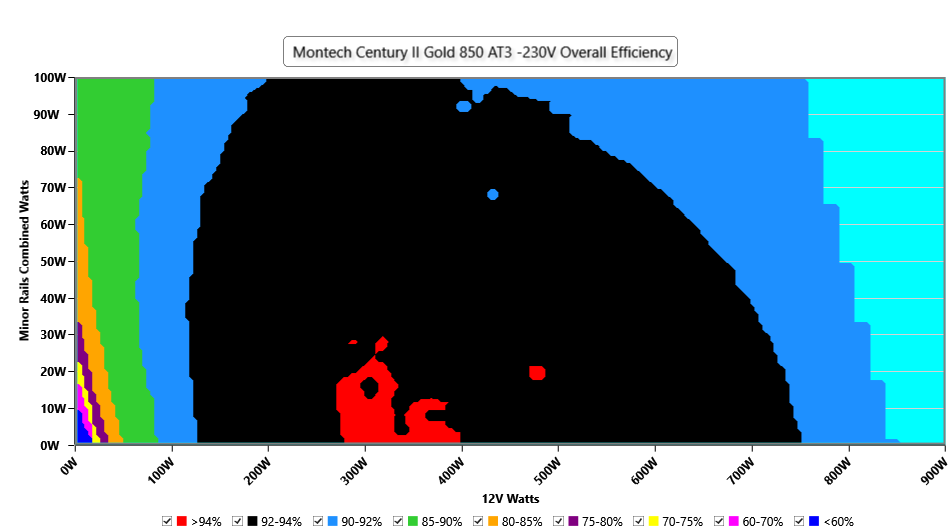
INFO
This graph depicts the PSU`s efficiency throughout its entire operational range. For the generation of the efficiency and noise graphs we set our loaders to auto mode through our custom-made software before trying thousands of possible load combinations
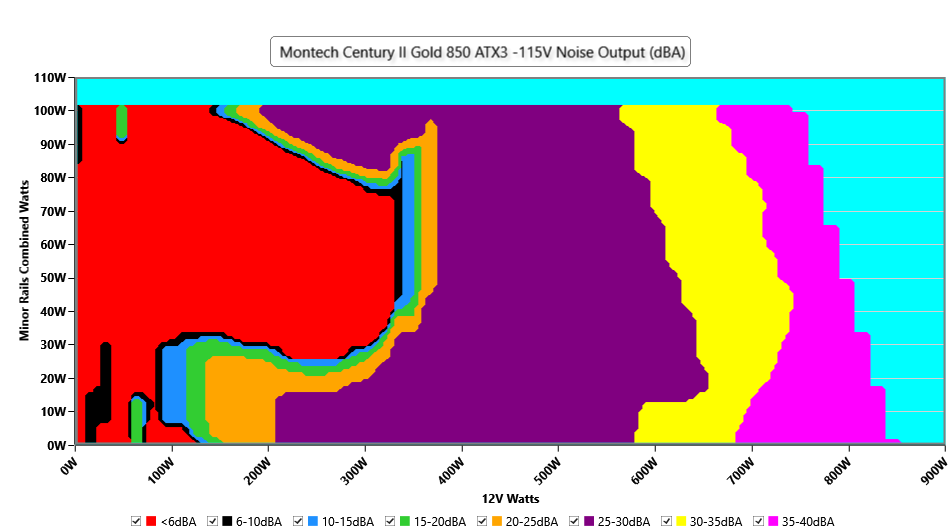
Noise Graph
INFO
The PSU`s noise in its entire operational range and under 30-32 °C ambient is depicted in this graph. The X axis represents the load on the +12V rail(s) while the Y axis is the load on the minor rails
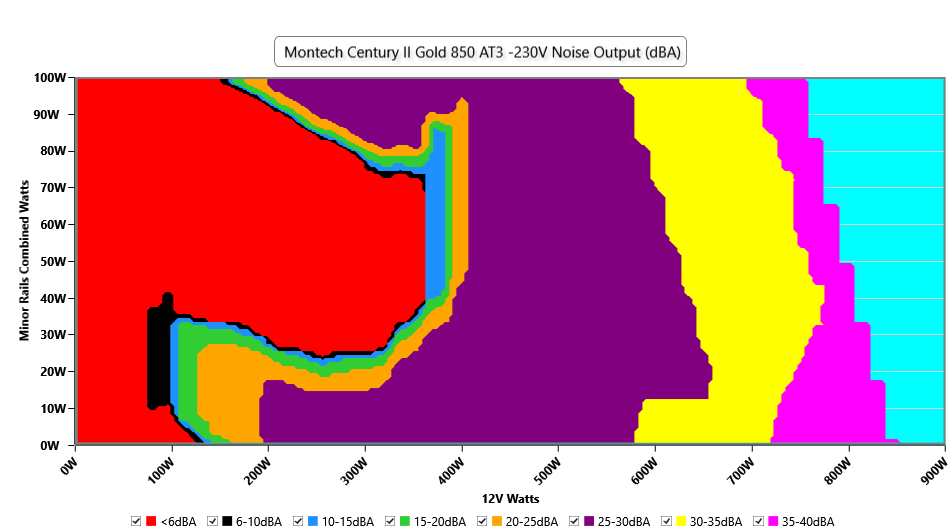
INFO
The PSU`s noise in its entire operational range and under 30-32 °C ambient is depicted in this graph. The X axis represents the load on the +12V rail(s) while the Y axis is the load on the minor rails
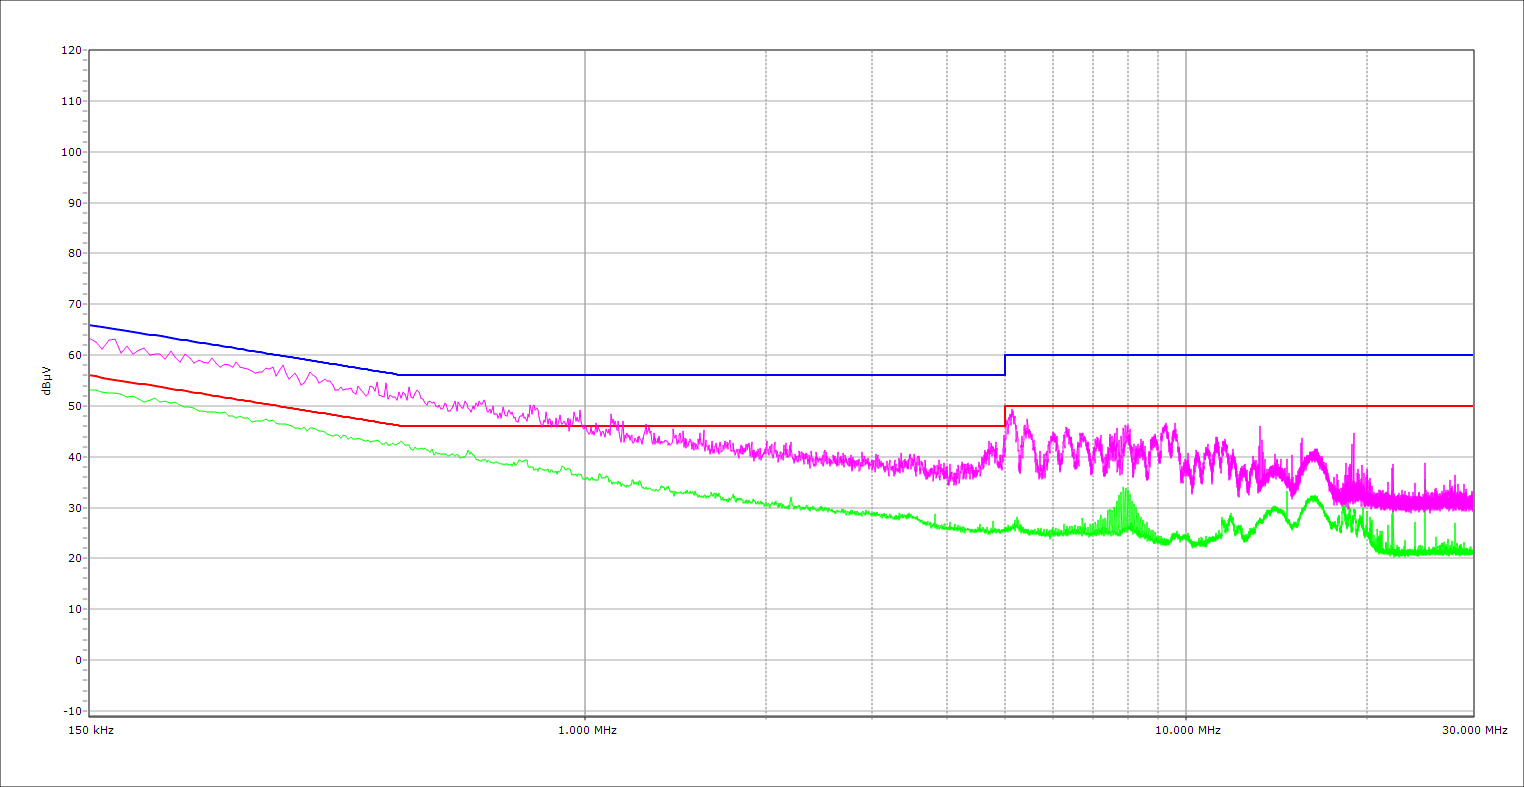
Conducted Emissions EN55032 & CISPR 32
NEUTRAL
PHASE
Indicative Performance
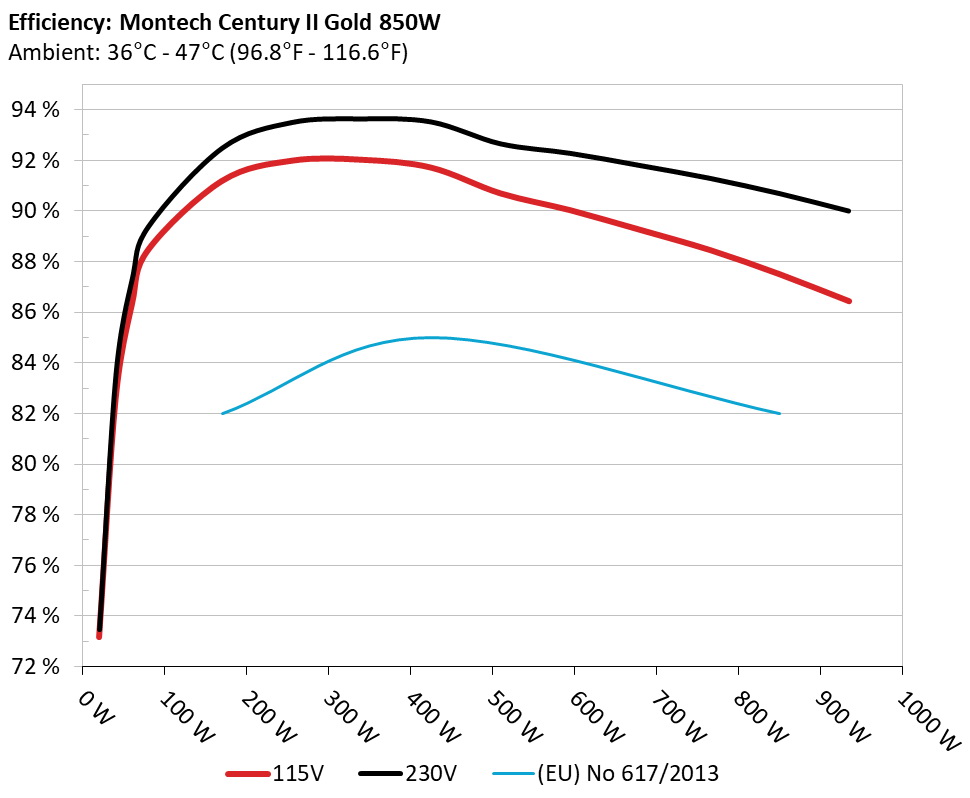
Efficiency under high ambient temperature
INFO
The PSU`s efficiency under high ambient temperatures with 115V and 230V input. For this graph the results of the 10-110% load regulation table are used
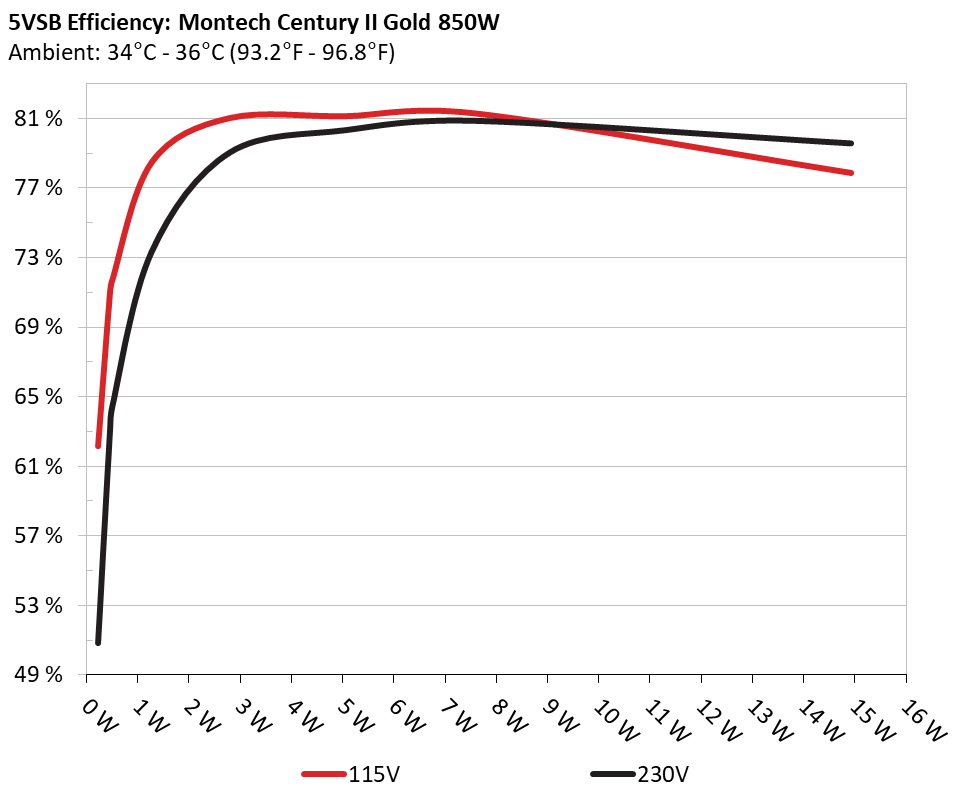
5VSB Efficiency
INFO
This graph depicts the efficiency levels of the 5VSB rail with 115V and 230V input


 Outside Validation Scope