61.80A (134.93%), 11.867V *Voltage Drop (11.319V @62.8A), High Ripple (>200mV)
60.80A (132.75%), 11.938V *High Ripple (>200mV)
5V OCP (26.6°C / 41.3°C)
21A (116.67%), 5.018V
20.6A (114.44%), 5.018V
3.3V OCP (26.6°C / 41.3°C)
23.6A (131.11%), 3.32V
22.7A (126.11%), 3.323V
5VSB OCP (26.6°C / 41.3°C)
5.5A (220.00%), 4.82V
5.3A (212.00%), 4.857V
OPP (27.04°C / 41.30°C)
121.92%
127.38%
保持时间 & PG信号
Hold-Up Time (ms)
15.2
AC Loss to PWR_OK Hold Up Time (ms)
13.8
PWR_OK Inactive to DC Loss Delay (ms)
1.4
待机电源
Tables
Detailed Results
Average
Min
Limit Min
Max
Limit Max
Result
Mains Voltage RMS:
115.08 V
115.04 V
113.85 V
115.13 V
116.15 V
PASS
Mains Frequency:
60.00 Hz
59.99 Hz
59.40 Hz
60.01 Hz
60.60 Hz
PASS
Mains Voltage CF:
1.416
1.415
1.340
1.418
1.490
PASS
Mains Voltage THD:
0.13 %
0.10 %
N/A
0.17 %
2.00 %
PASS
Real Power:
0.053 W
0.002 W
N/A
0.086 W
N/A
N/A
Apparent Power:
8.634 W
7.900 W
N/A
9.265 W
N/A
N/A
Power Factor:
0.008
N/A
N/A
N/A
N/A
N/A
Detailed Results
Average
Min
Limit Min
Max
Limit Max
Result
Mains Voltage RMS:
231.03 V
230.91 V
227.70 V
231.10 V
232.30 V
PASS
Mains Frequency:
50.00 Hz
49.99 Hz
49.50 Hz
50.01 Hz
50.50 Hz
PASS
Mains Voltage CF:
1.417
1.416
1.340
1.419
1.490
PASS
Mains Voltage THD:
0.17 %
0.14 %
N/A
0.29 %
2.00 %
PASS
Real Power:
0.143 W
0.094 W
N/A
0.212 W
N/A
N/A
Apparent Power:
27.206 W
26.154 W
N/A
28.192 W
N/A
N/A
Power Factor:
0.004
N/A
N/A
N/A
N/A
N/A
Graphs
转换效率图表
资讯
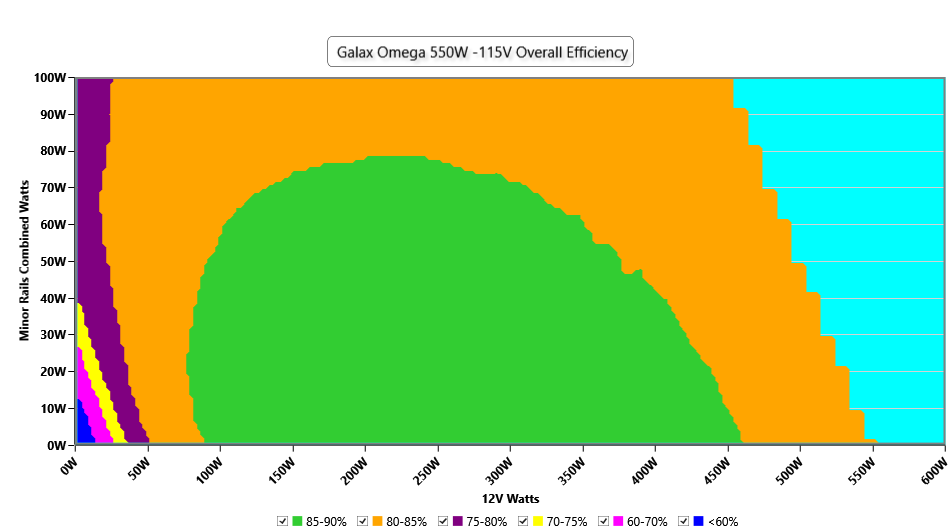
This graph depicts the PSU`s efficiency throughout its entire operational range. For the generation of the efficiency and noise graphs we set our loaders to auto mode through our custom-made software before trying thousands of possible load combinations
资讯
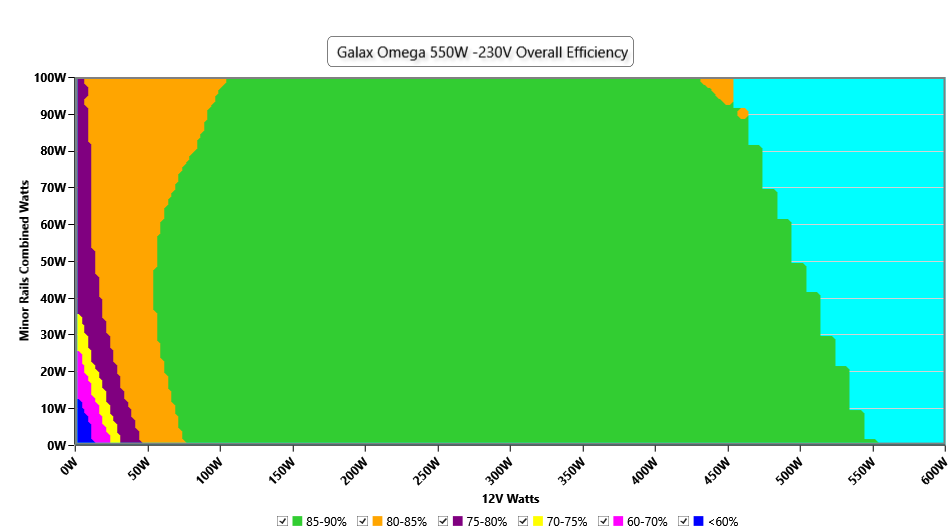
This graph depicts the PSU`s efficiency throughout its entire operational range. For the generation of the efficiency and noise graphs we set our loaders to auto mode through our custom-made software before trying thousands of possible load combinations
噪音值图表
资讯
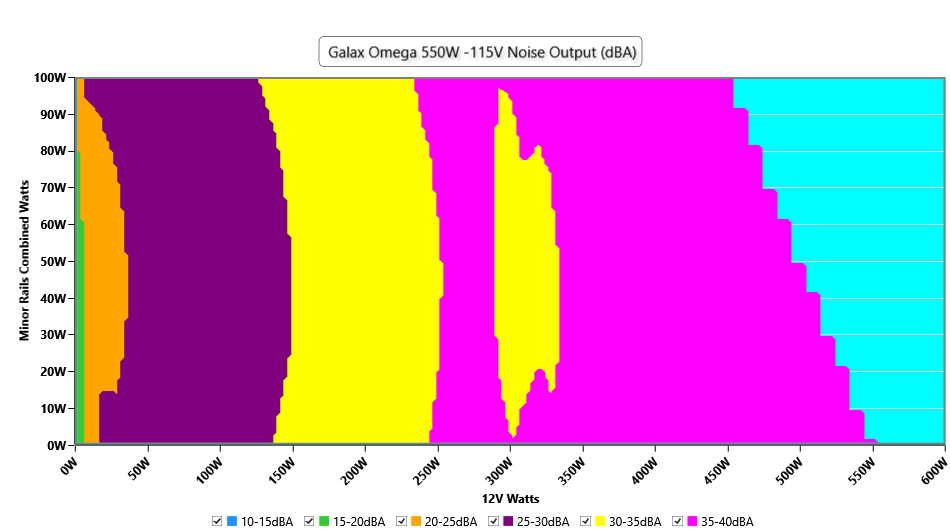
The PSU`s noise in its entire operational range and under 30-32 °C ambient is depicted in this graph. The X axis represents the load on the +12V rail(s) while the Y axis is the load on the minor rails
资讯
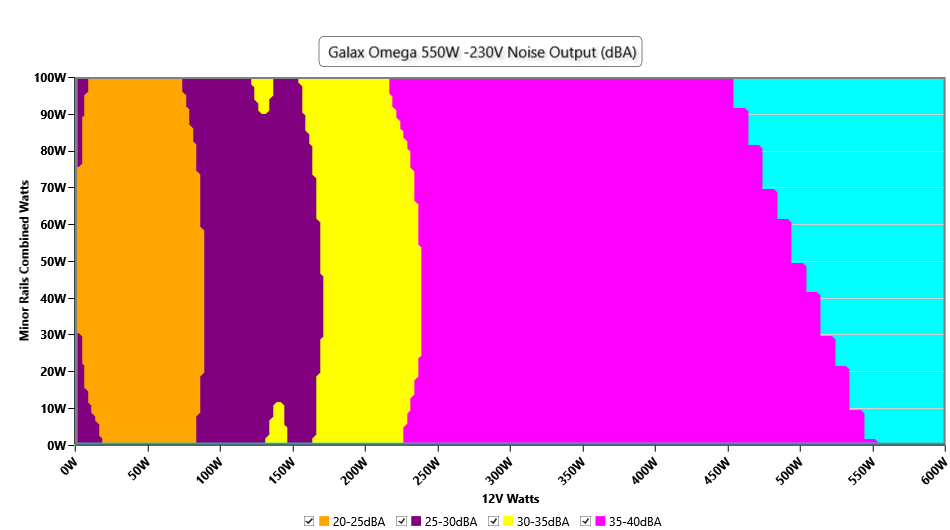
The PSU`s noise in its entire operational range and under 30-32 °C ambient is depicted in this graph. The X axis represents the load on the +12V rail(s) while the Y axis is the load on the minor rails
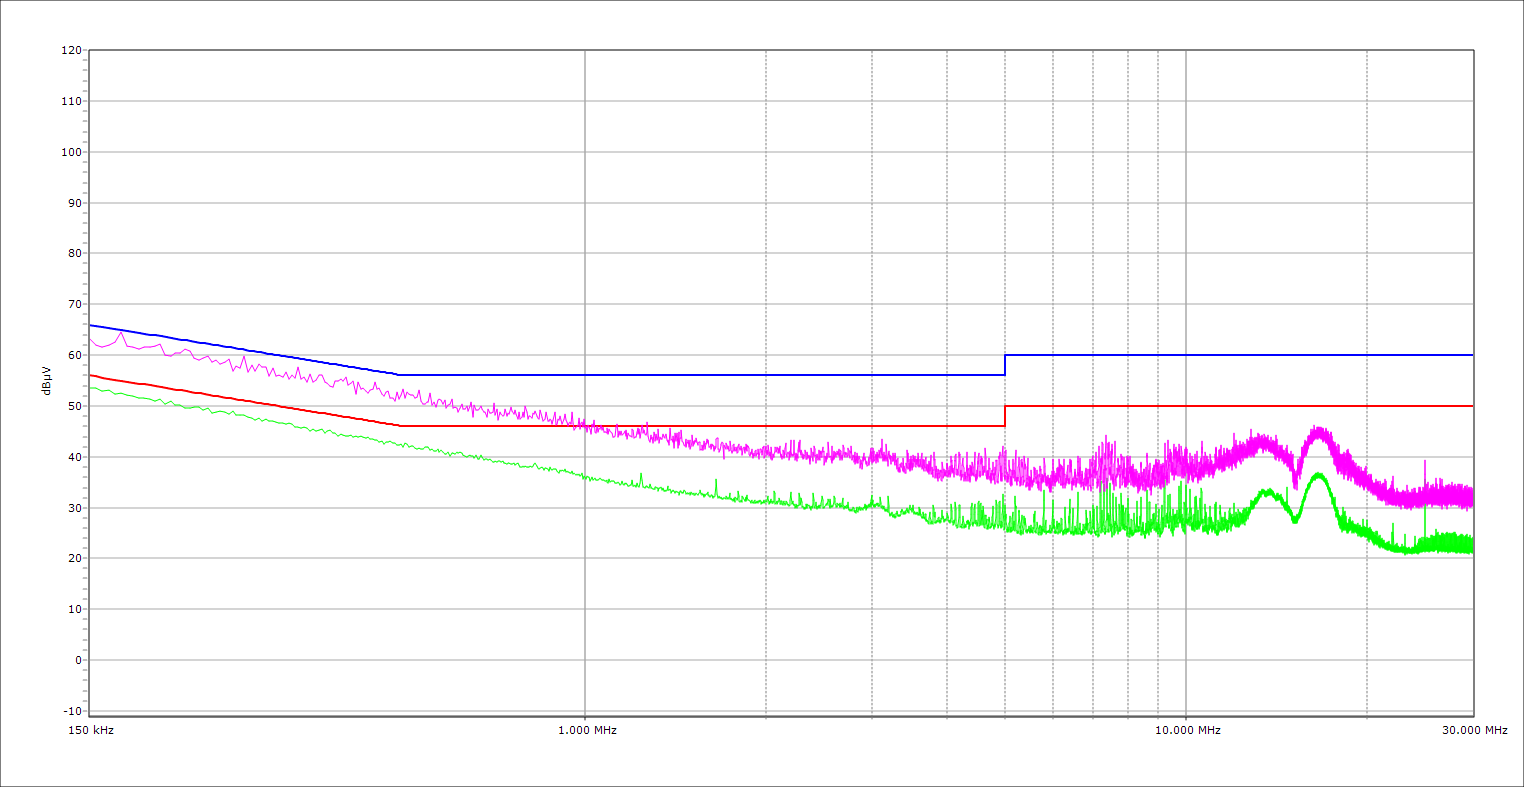
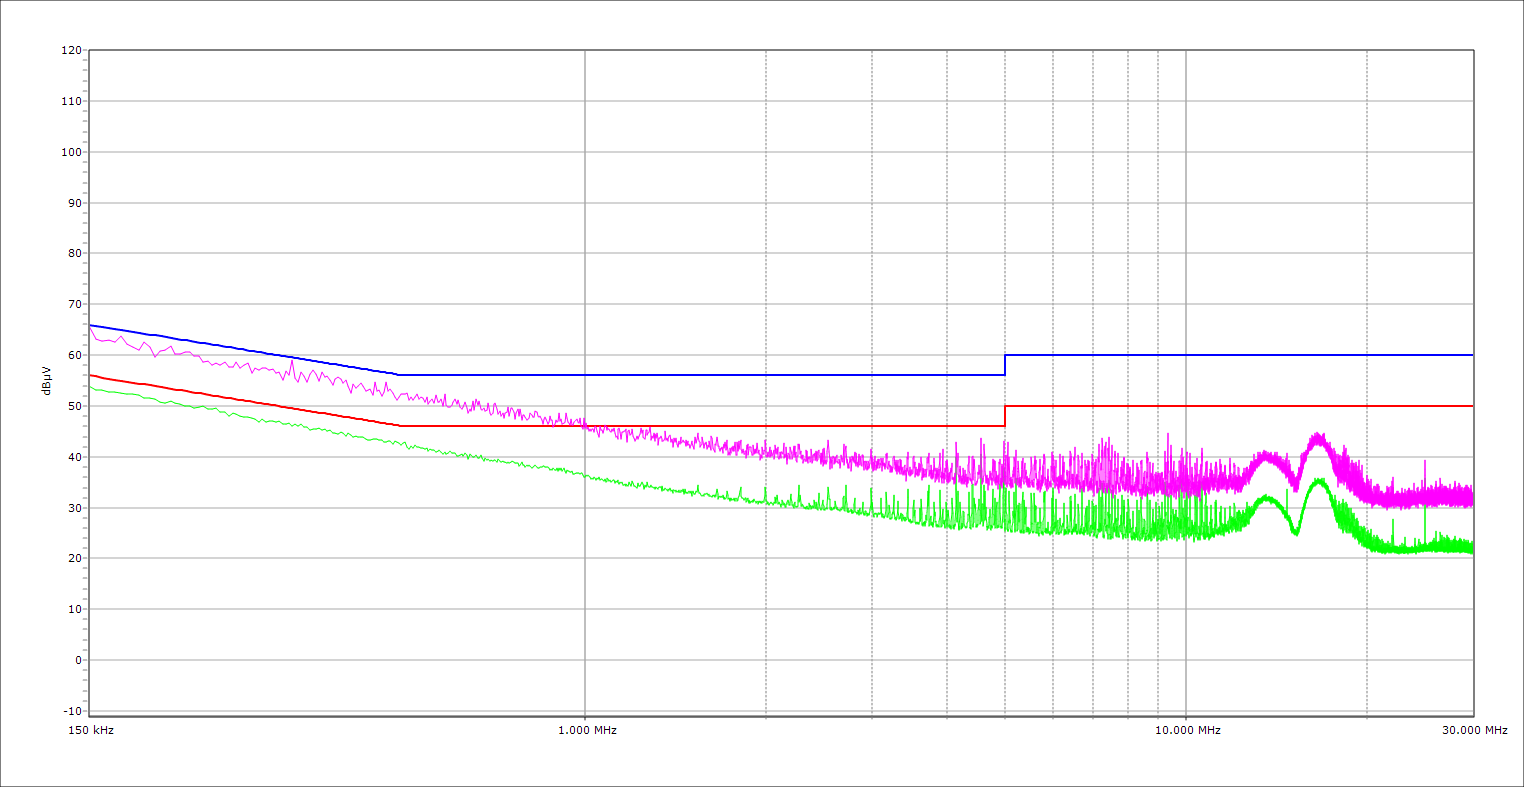
Conducted Emissions EN55032 & CISPR 32
NEUTRAL
PHASE
Indicative Performance
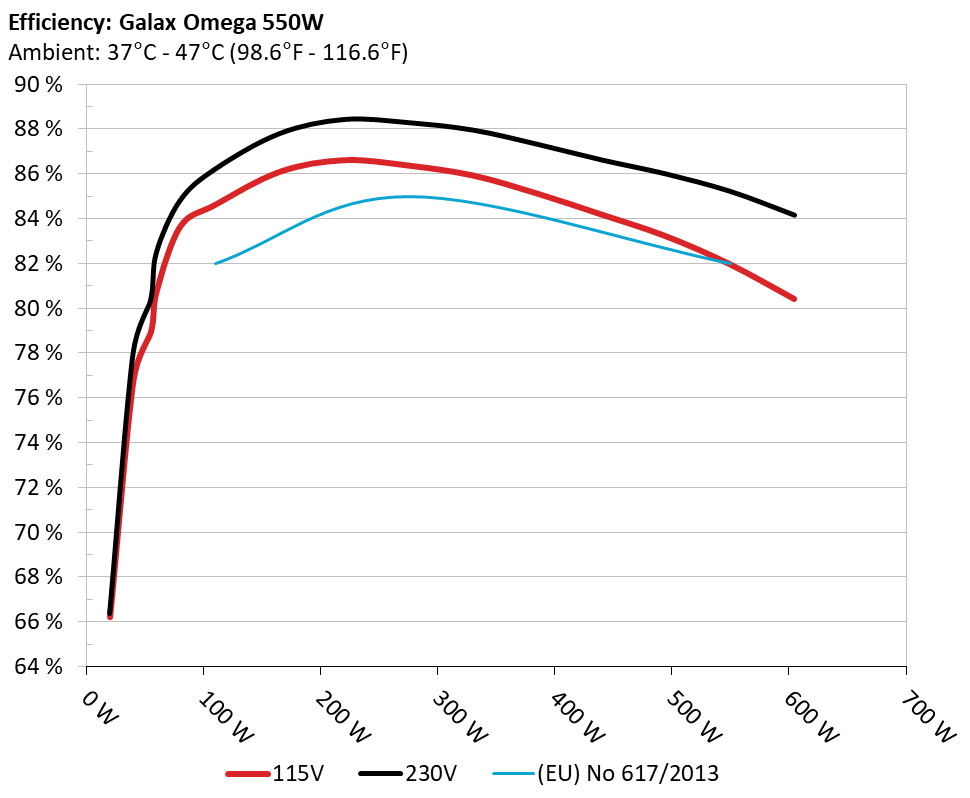
高环温电源转换效率
资讯
The PSU`s efficiency under high ambient temperatures with 115V and 230V input. For this graph the results of the 10-110% load regulation table are used
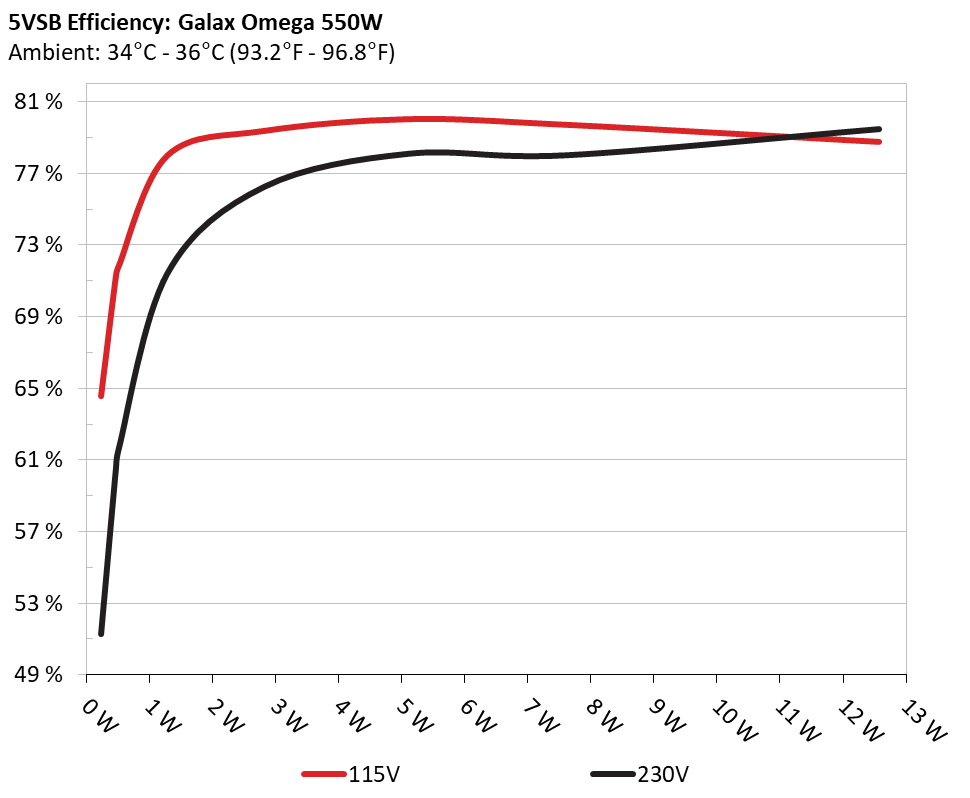
5Vsb转换效率
资讯
This graph depicts the efficiency levels of the 5VSB rail with 115V and 230V input