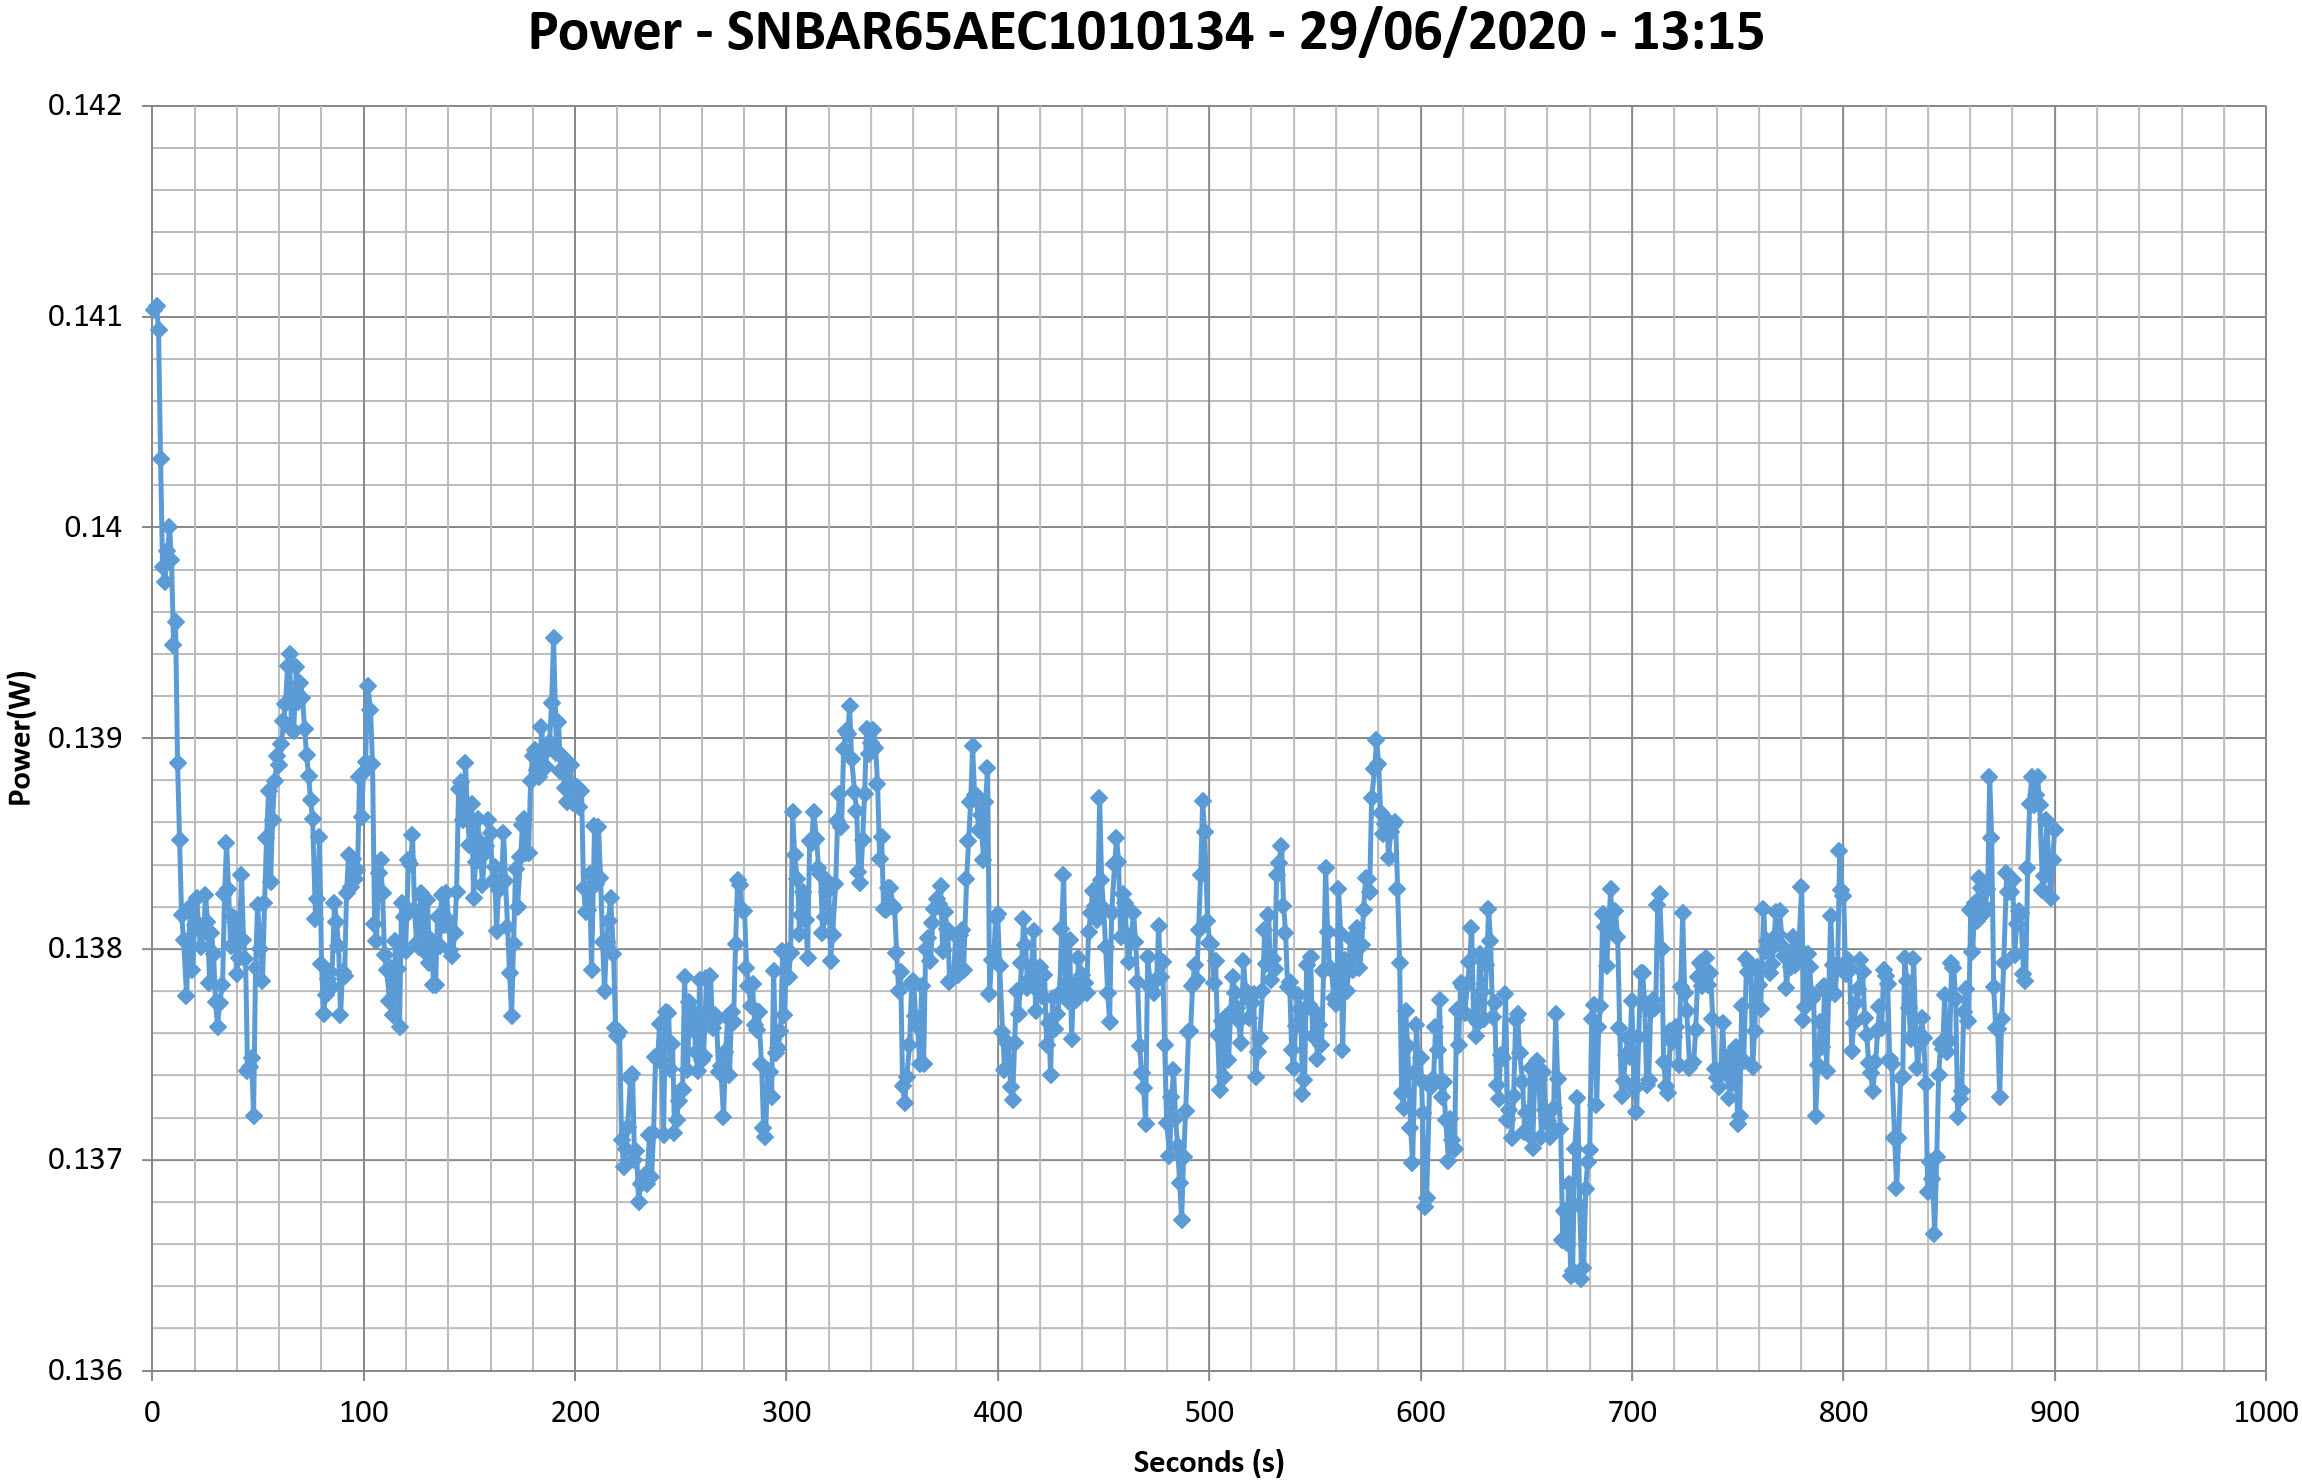
This graph is generated by the PPA Standby Power Analysis software which takes full control of the power analyzer during the whole procedure. This application features all of the EN50564 & IEC62301 test limits for standby power software testing
转换效率图表
230V
资讯
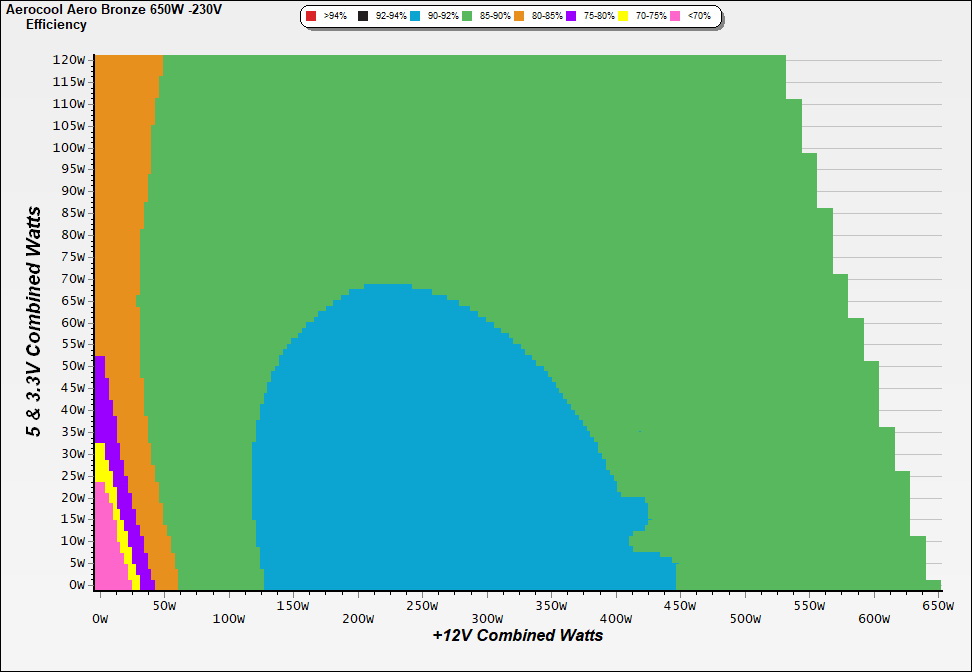
This graph depicts the PSU`s efficiency throughout its entire operational range. For the generation of the efficiency and noise graphs we set our loaders to auto mode through our custom-made software before trying thousands of possible load combinations
噪音值图表
230V
资讯
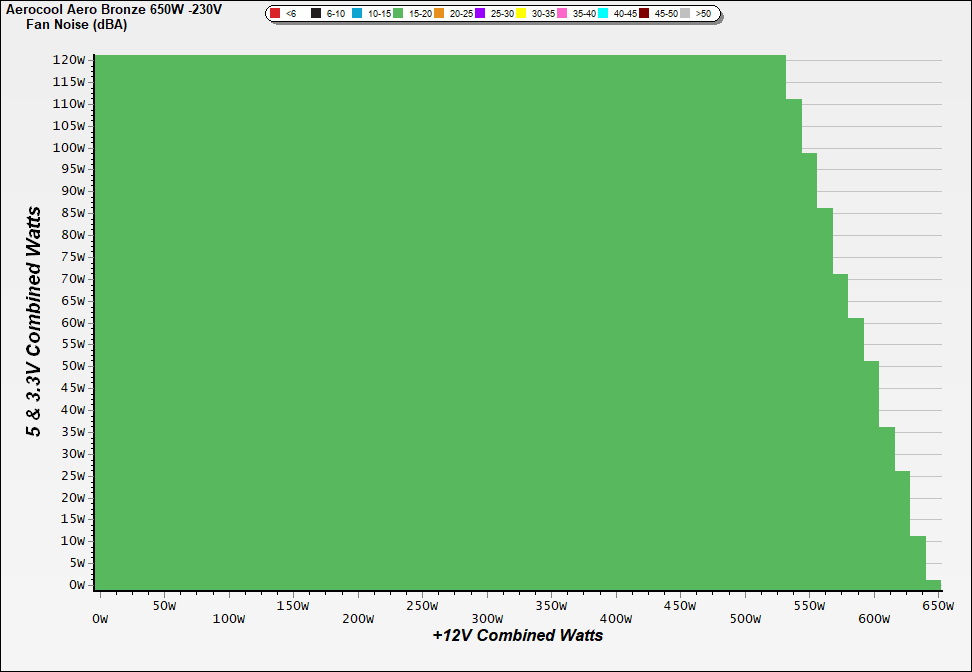
The PSU`s noise in its entire operational range and under 30-32 °C ambient is depicted in this graph. The X axis represents the load on the +12V rail(s) while the Y axis is the load on the minor rails
Conducted Emissions EN55032 & CISPR 32
Indicative Performance
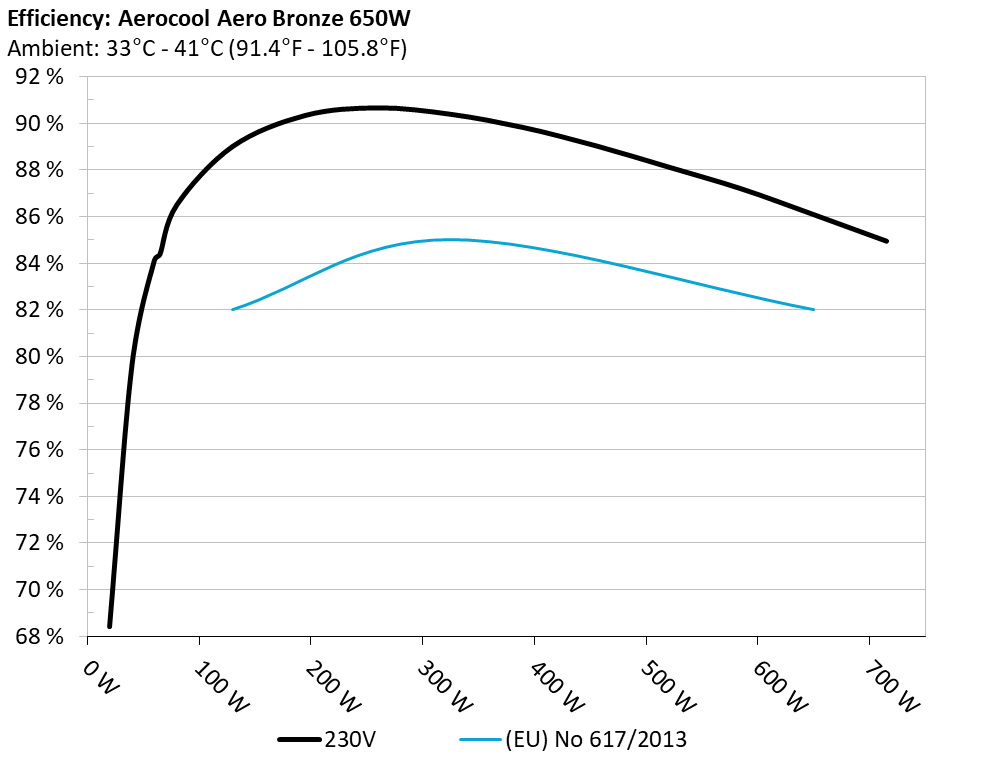
高环温电源转换效率
资讯
The PSU`s efficiency under high ambient temperatures with 115V and 230V input. For this graph the results of the 10-110% load regulation table are used
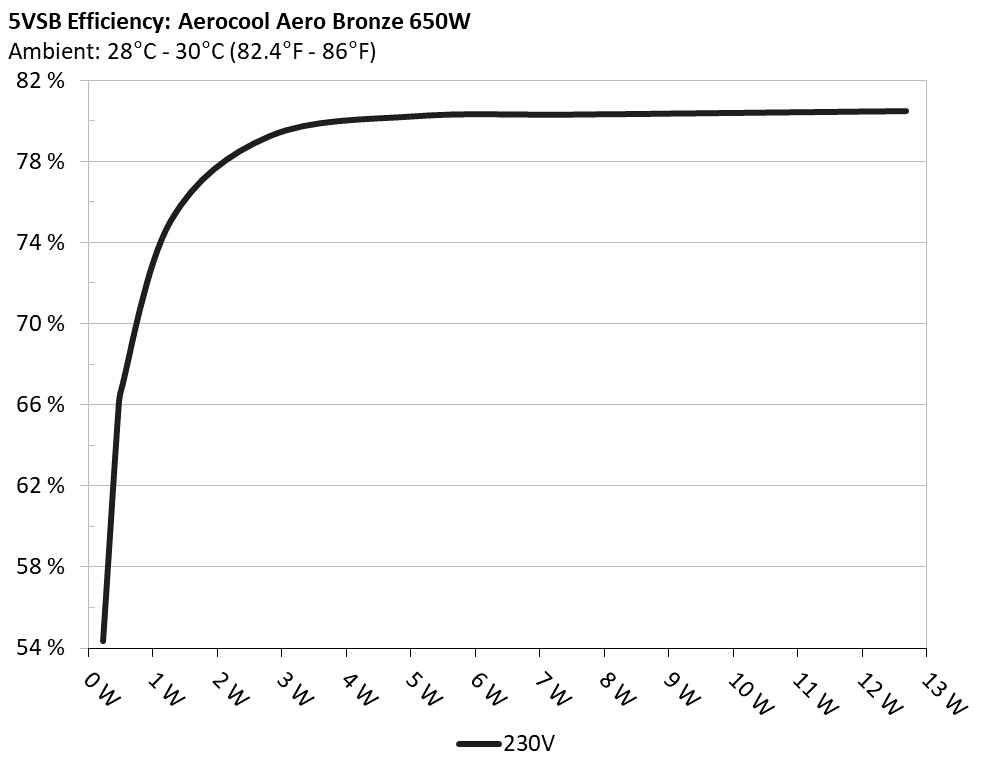
5Vsb转换效率
资讯
This graph depicts the efficiency levels of the 5VSB rail with 115V and 230V input
输入电压 时的5Vsb 效率 (ErP Lot3/6 & CEC) 230V
Protection Features
Supplementary Tests (For Reference)
10-110%负载测试 230V
The results above are not used in the certification process
20-80瓦负载测试 230V
The results above are not used in the certification process
纹波测量 230V
The results above are not used in the certification process