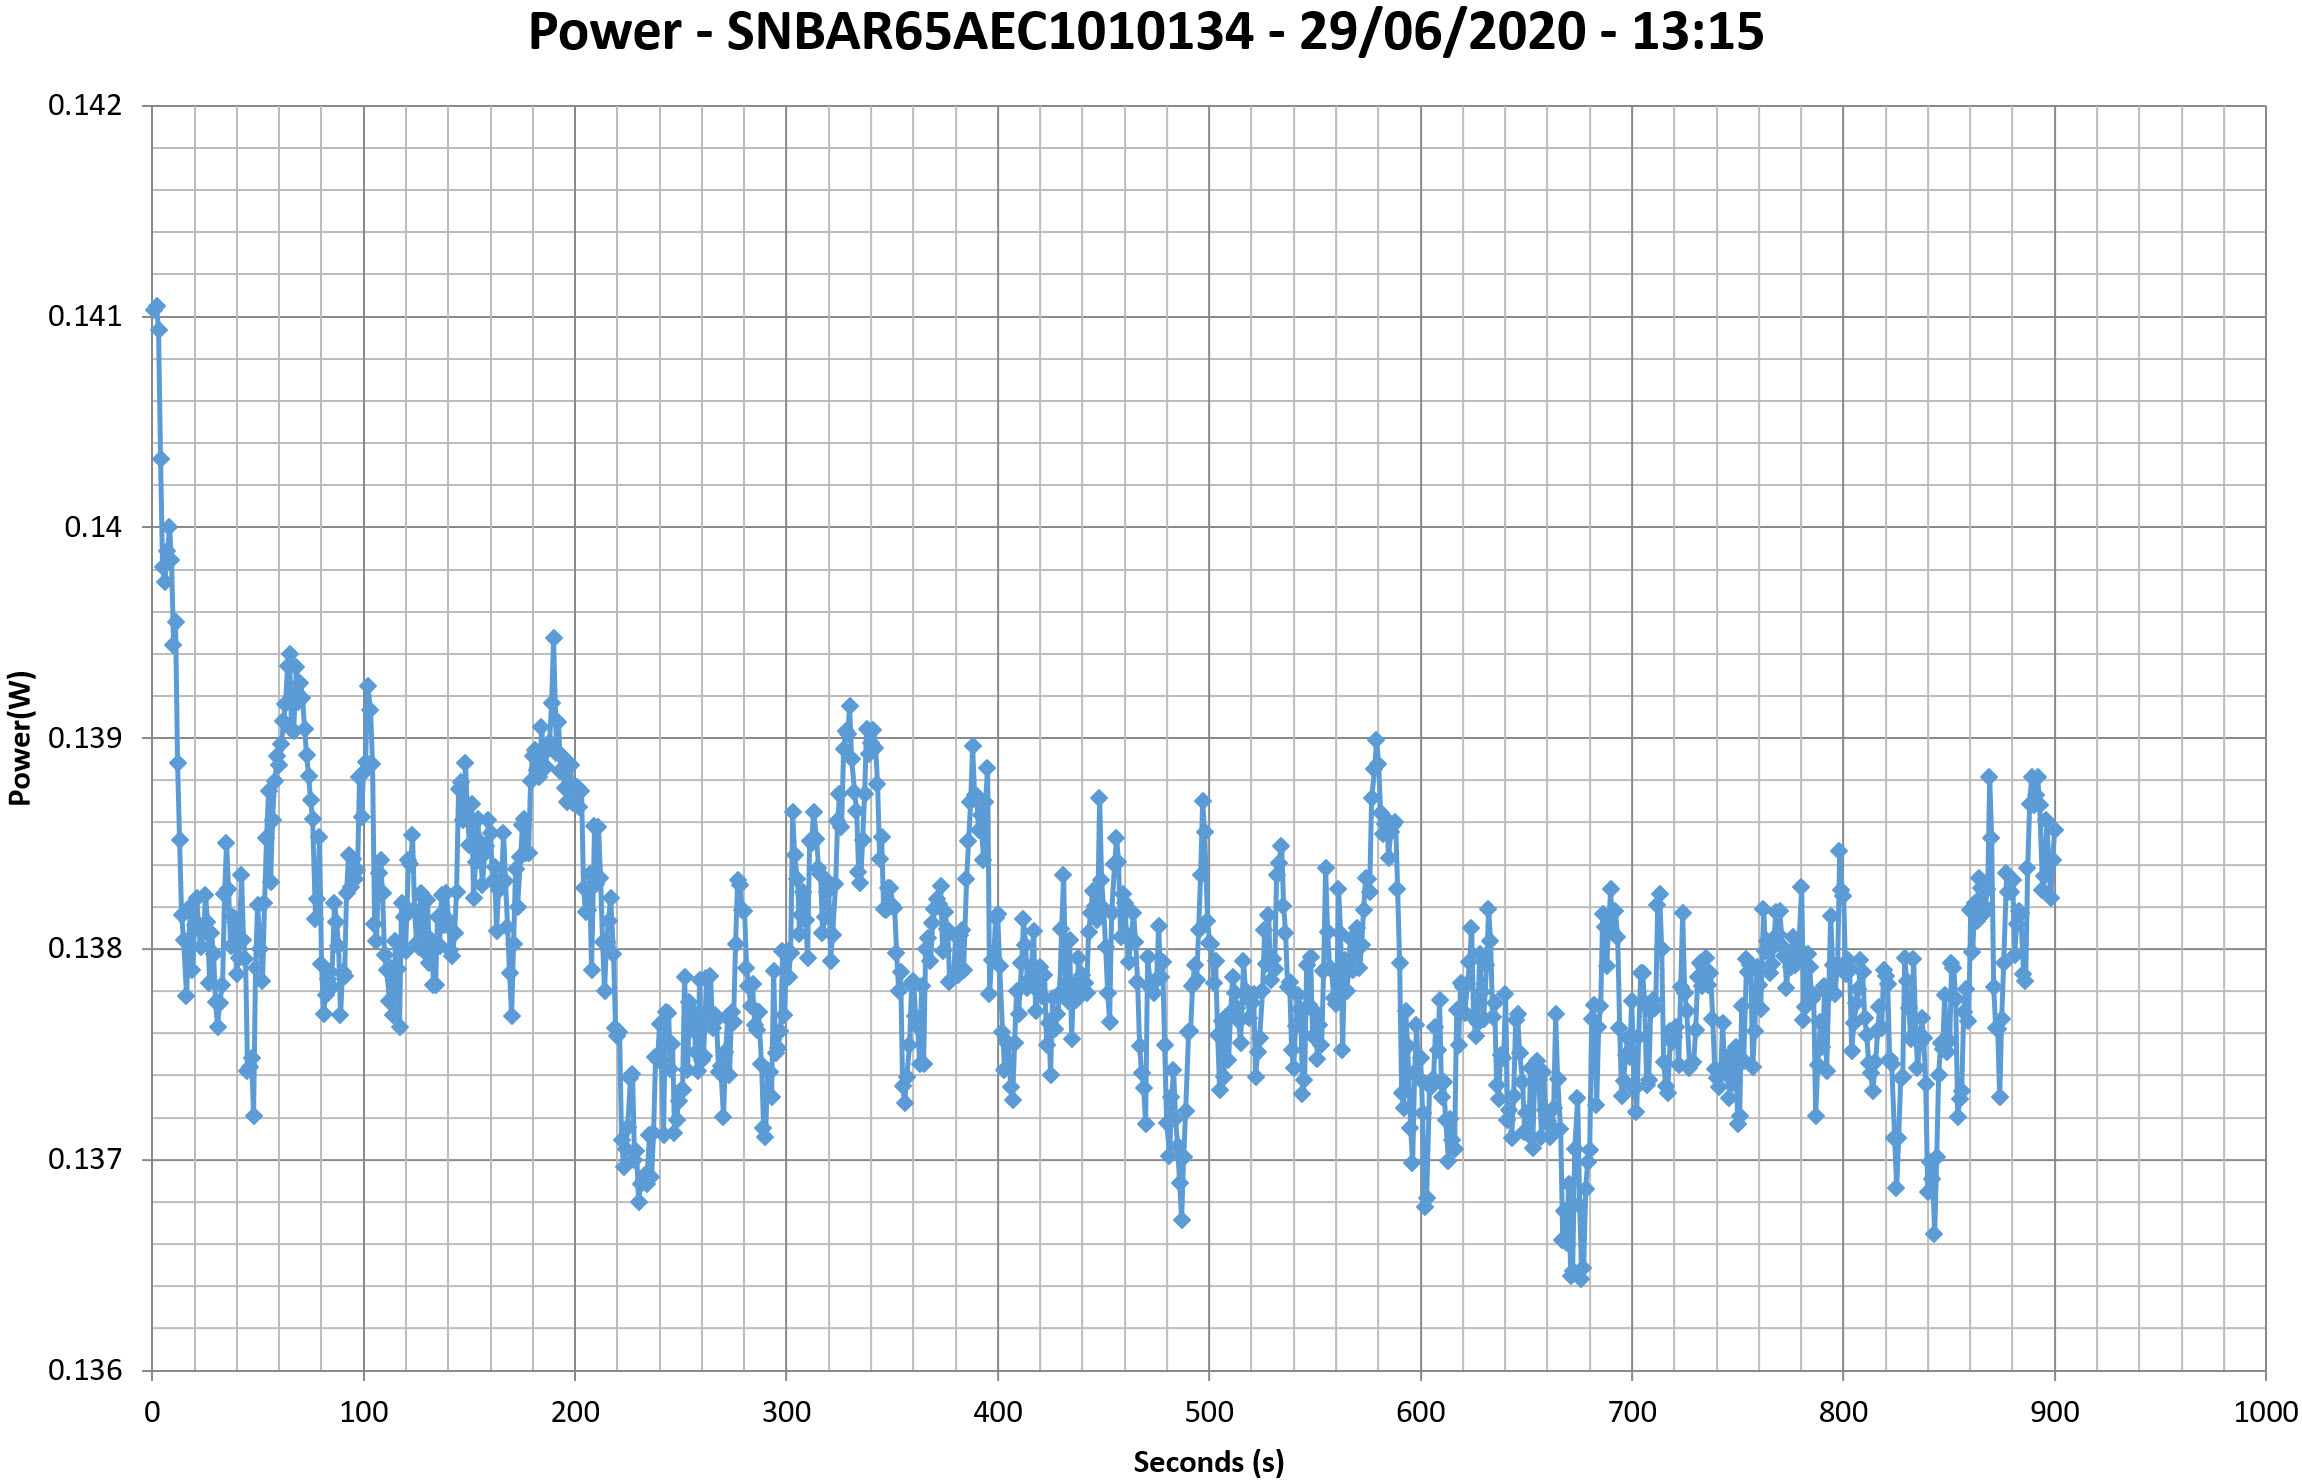
This graph is generated by the PPA Standby Power Analysis software which takes full control of the power analyzer during the whole procedure. This application features all of the EN50564 & IEC62301 test limits for standby power software testing
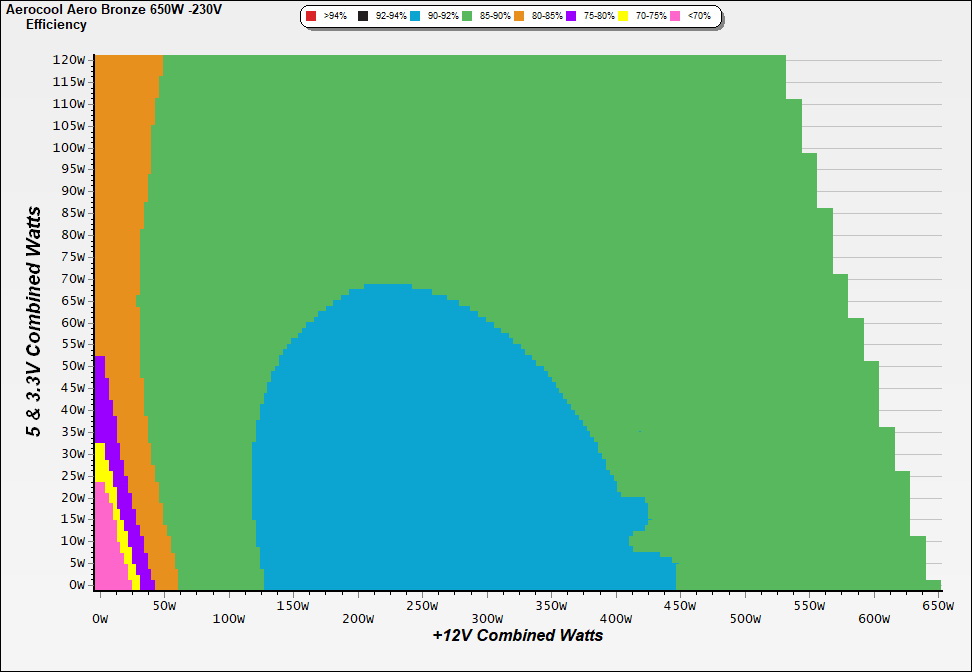
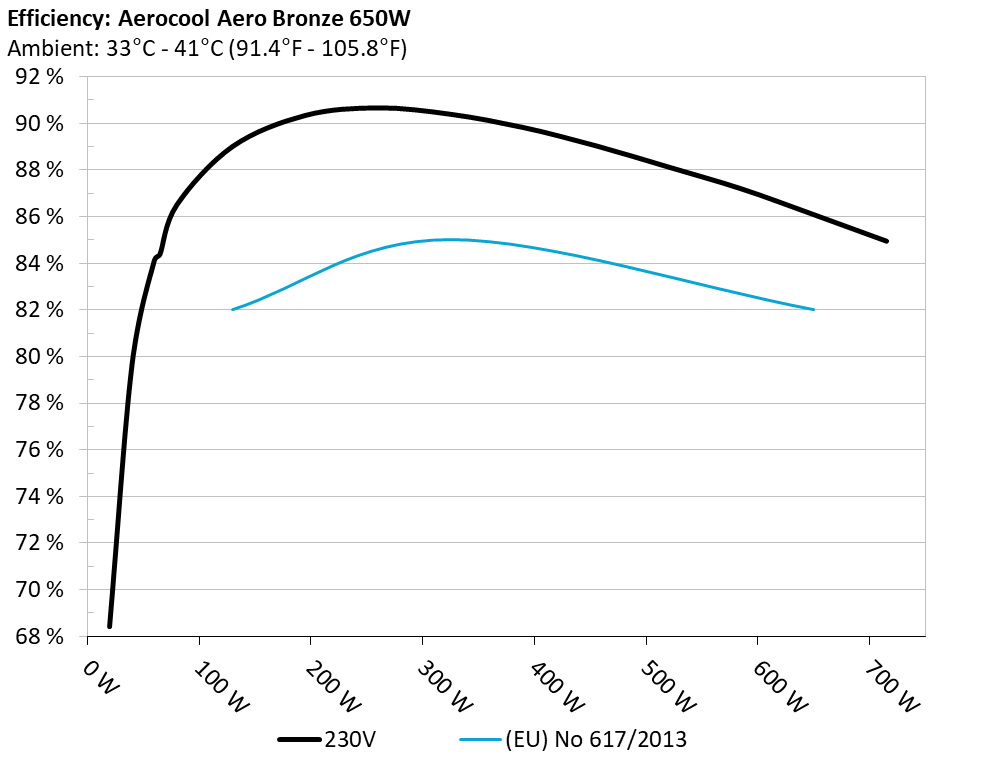
Efficiency Graph
230V
INFO
This graph depicts the PSU`s efficiency throughout its entire operational range. For the generation of the efficiency and noise graphs we set our loaders to auto mode through our custom-made software before trying thousands of possible load combinations
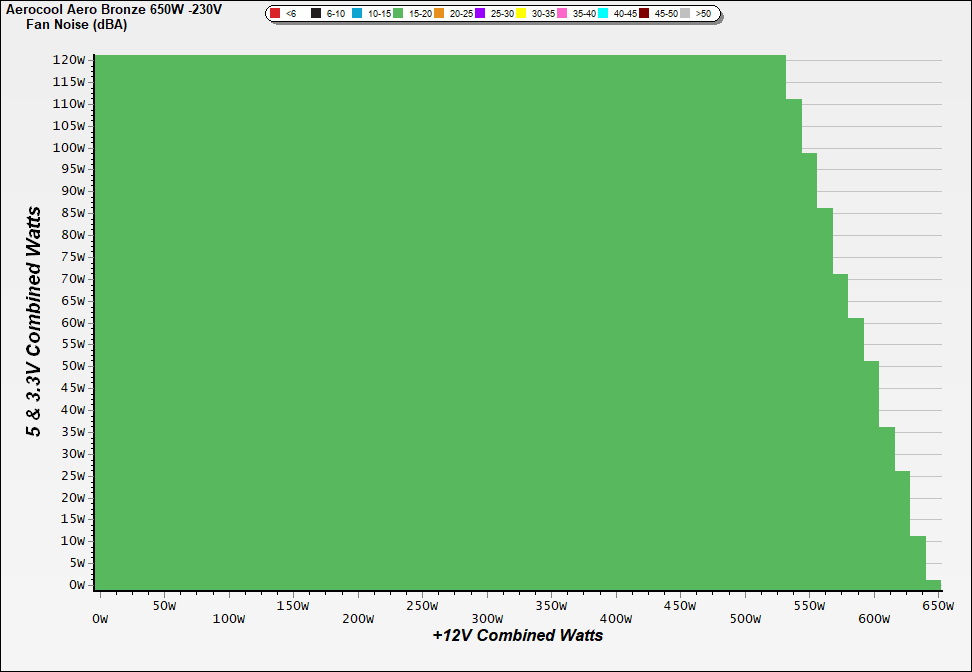
Noise Graph
230V
INFO
The PSU`s noise in its entire operational range and under 30-32 °C ambient is depicted in this graph. The X axis represents the load on the +12V rail(s) while the Y axis is the load on the minor rails
Conducted Emissions EN55032 & CISPR 32
Indicative Performance
Efficiency under high ambient temperature
INFO
The PSU`s efficiency under high ambient temperatures with 115V and 230V input. For this graph the results of the 10-110% load regulation table are used
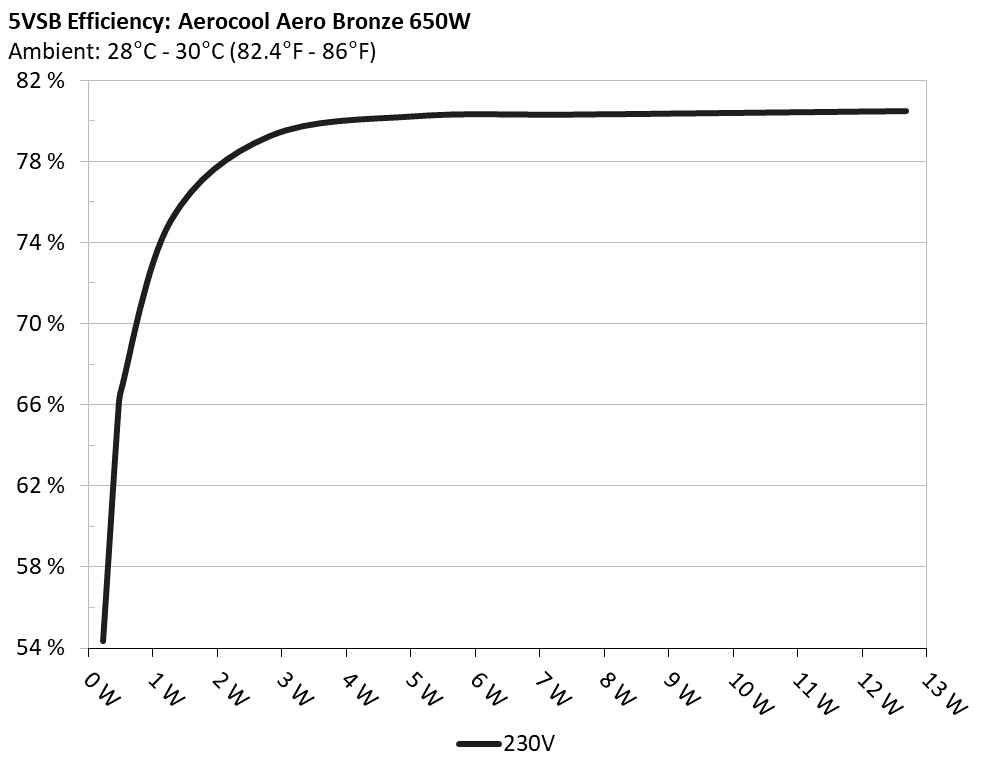
5VSB Efficiency
INFO
This graph depicts the efficiency levels of the 5VSB rail with 115V and 230V input
5VSB Efficiency (ERP LOT 3/6 & CEC) 230V
Protection Features
Supplementary Tests (For Reference)
Typical Load Tests 230V
The results above are not used in the certification process
Light Load Tests 230V
The results above are not used in the certification process
Ripple Measurements 230V
The results above are not used in the certification process
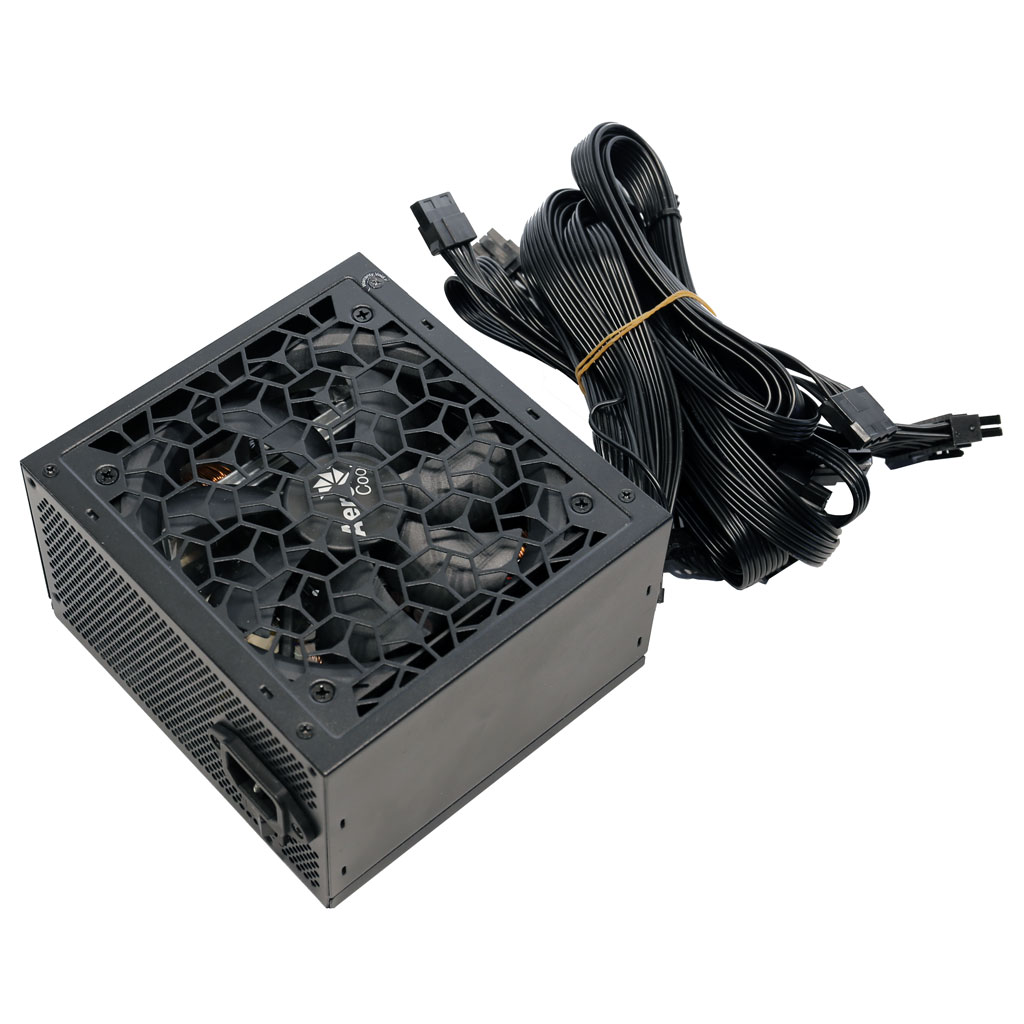
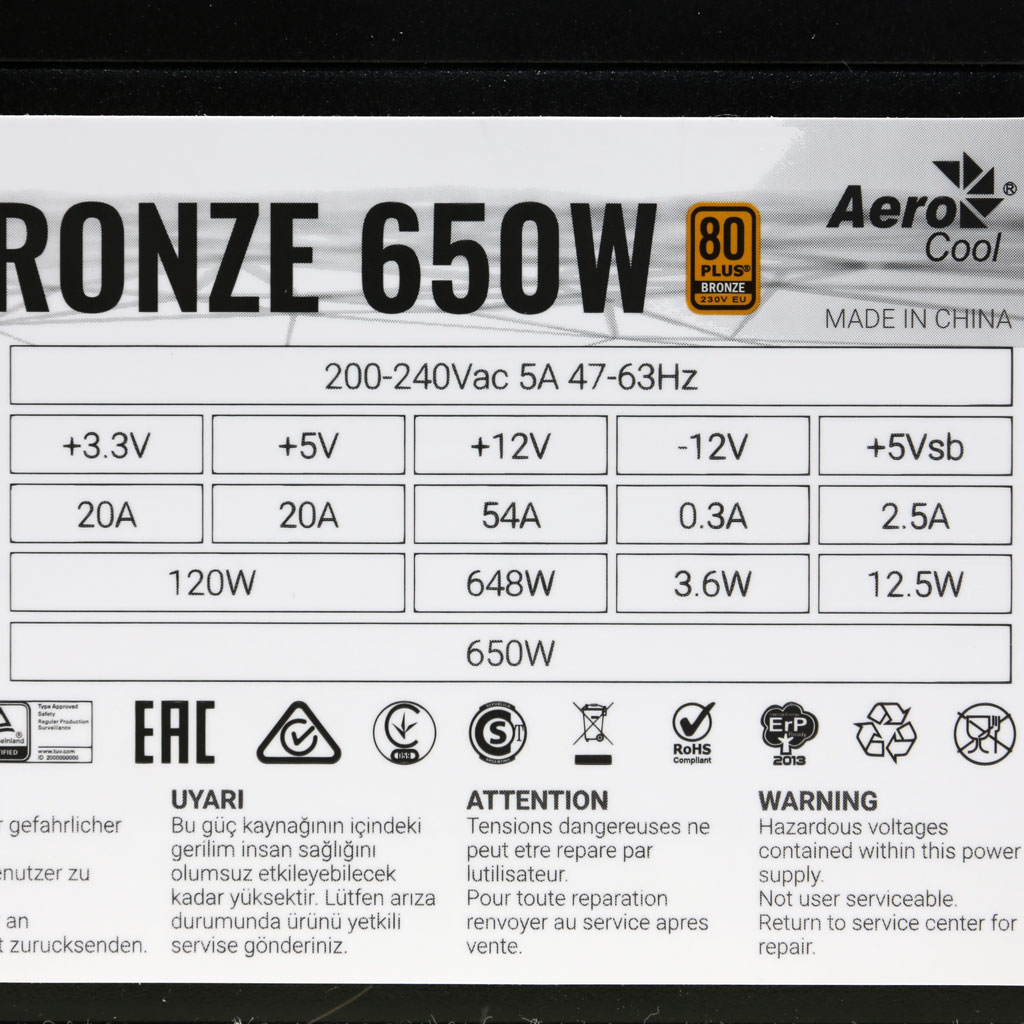
Aerocool Aero Bronze 650W
Top side
Power specifications label
ybenetics bietet die freiwilligen ETA- und Lambda-Zertifizierungsprogramme an, mit denen effiziente und leise Netzteile (PSU) beworben werden