Cables and Connectors(Non-accredited measurements)
Native Cables
Description
Cable Count
Connector Count (Total)
Gauge
In Cable Caps
ATX connector 20+4 pin (520mm)
1
1
18-22AWG
No
4+4 pin EPS12V (620mm)
1
1
18AWG
No
6+2 pin PCIe (520mm+150mm)
1
2
18-20AWG
No
SATA (530mm+150mm+150mm) / 4-pin Molex (+150mm)
2
4 / 2
18-20AWG
No
SATA (530mm) / 4-pin Molex (+150mm+150mm)
1
1 / 2
18-20AWG
No
SATA (530mm) / 4-pin Molex (+150mm) / FDD(+150mm)
1
1 / 1 / 1
18-22AWG
No
Modular Cables
AC Power Cord (1380mm) - C13 coupler
1
1
18AWG
-
Test Results
Temperature & Compliance Info
Temperature Range (°C /°F)
30-32 / 86-89.6
ErP Lot 3/6 Ready
✓
(EU) No 617/2013 Compliance
✓
Performance Summary 230V
Wirkungsgrad
BRONZE
Lautstärkeklasse
Standard
Average Efficiency (>1450 load combinations)
84.403%
Average Noise Output (>1450 Load Combinations)
40.45dBA
Average PF (>1450 Load Combinations)
0.959
Efficiency With 10W (≤500W) or 2% (>500W) Load
0.000%
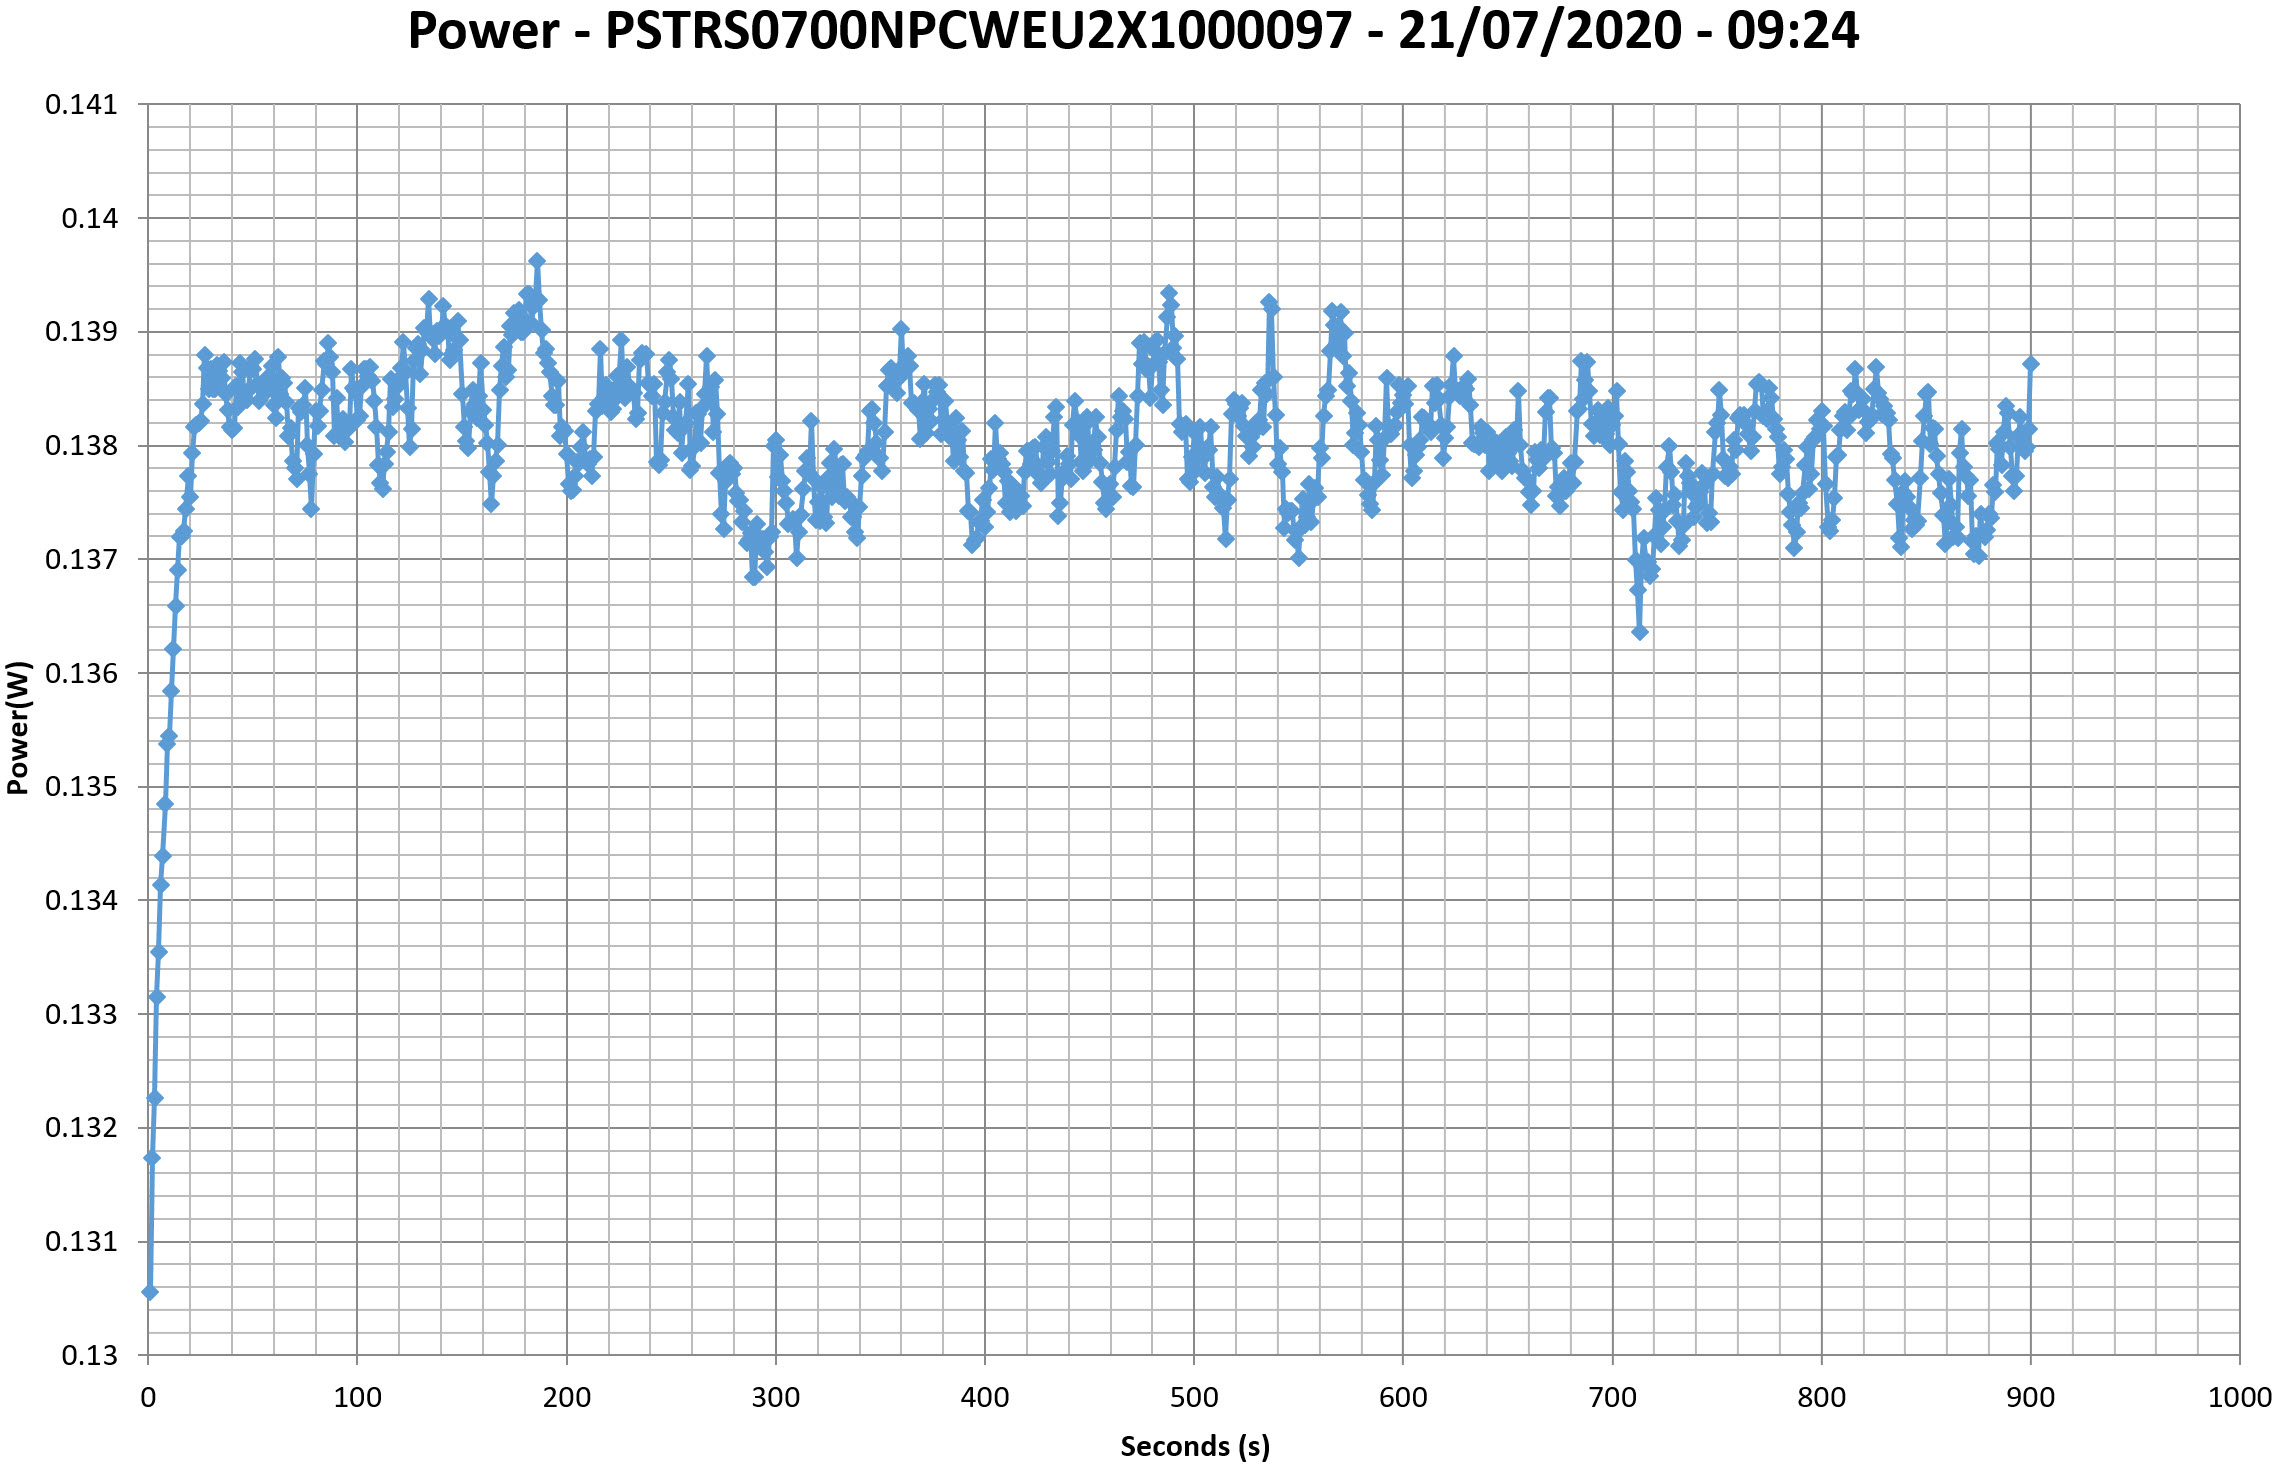
Standby Power Consumption
0.1387W
12V Ripple (Full Load)
45.97mV
5V Ripple (Full Load)
20.60mV
3.3V Ripple (Full Load)
25.67mV
5VSB Ripple (Full Load)
34.01mV
12V Load Regulation
3.18%
5V Load Regulation
2.53%
3.3V Load Regulation
3.58%
5VSB Load Regulation
4.36%
Inrush Current
80.990A
Hold-Up Time & Power Ok Signal
12.50ms
AC Loss to PWR_OK Hold Up Time
12.60ms
PWR_OK Inactive to DC Loss Delay
-0.10ms
PSU Timings: T1 (20% / 100%)
50.0ms
52.0ms
PSU Timings: T3 (20% / 100%)
295.0ms
295.0ms
OPP (0.00°C / 0.00°C)
114.01%
0.00%
Hold-Up Time & Power Ok Signal
Hold-Up Time (ms)
12.5
AC Loss to PWR_OK Hold Up Time (ms)
12.6
PWR_OK Inactive to DC Loss Delay (ms)
-0.1
Stromverbrauch im Ruhezustand
Tables 230V
Graphs 230V
INFO
This graph is generated by the PPA Standby Power Analysis software which takes full control of the power analyzer during the whole procedure. This application features all of the EN50564 & IEC62301 test limits for standby power software testing
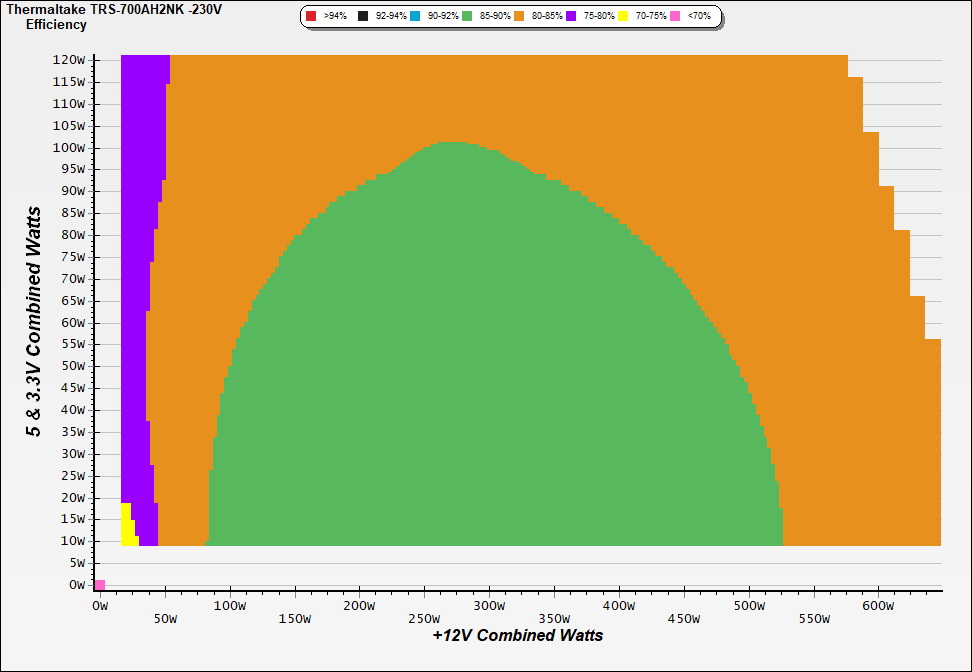
Efficiency Graph
230V
INFO
This graph depicts the PSU`s efficiency throughout its entire operational range. For the generation of the efficiency and noise graphs we set our loaders to auto mode through our custom-made software before trying thousands of possible load combinations
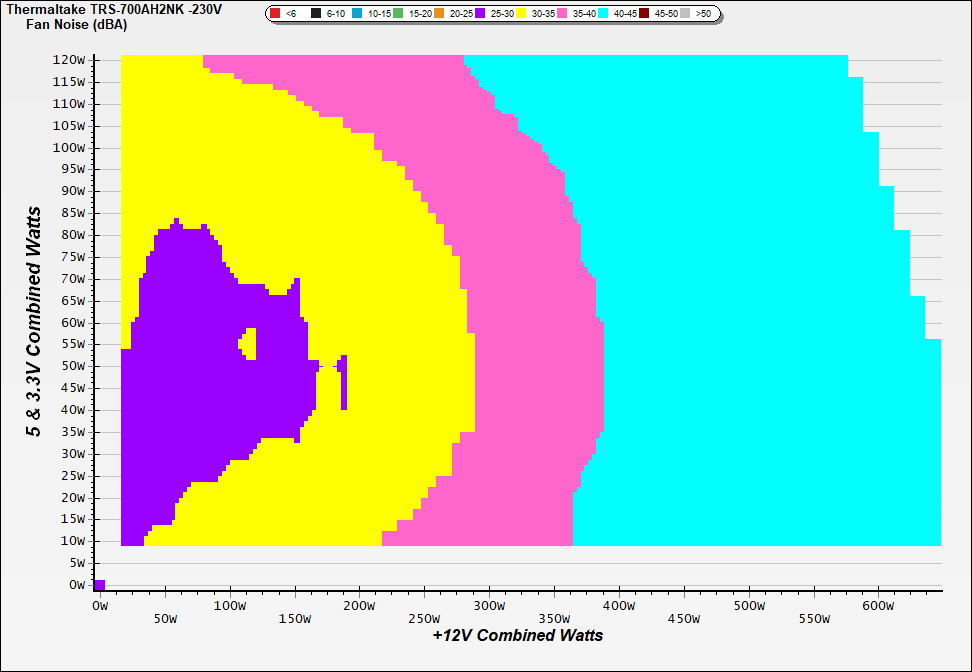
Noise Graph
230V
INFO
The PSU`s noise in its entire operational range and under 30-32 °C ambient is depicted in this graph. The X axis represents the load on the +12V rail(s) while the Y axis is the load on the minor rails
Conducted Emissions EN55032 & CISPR 32
Indicative Performance
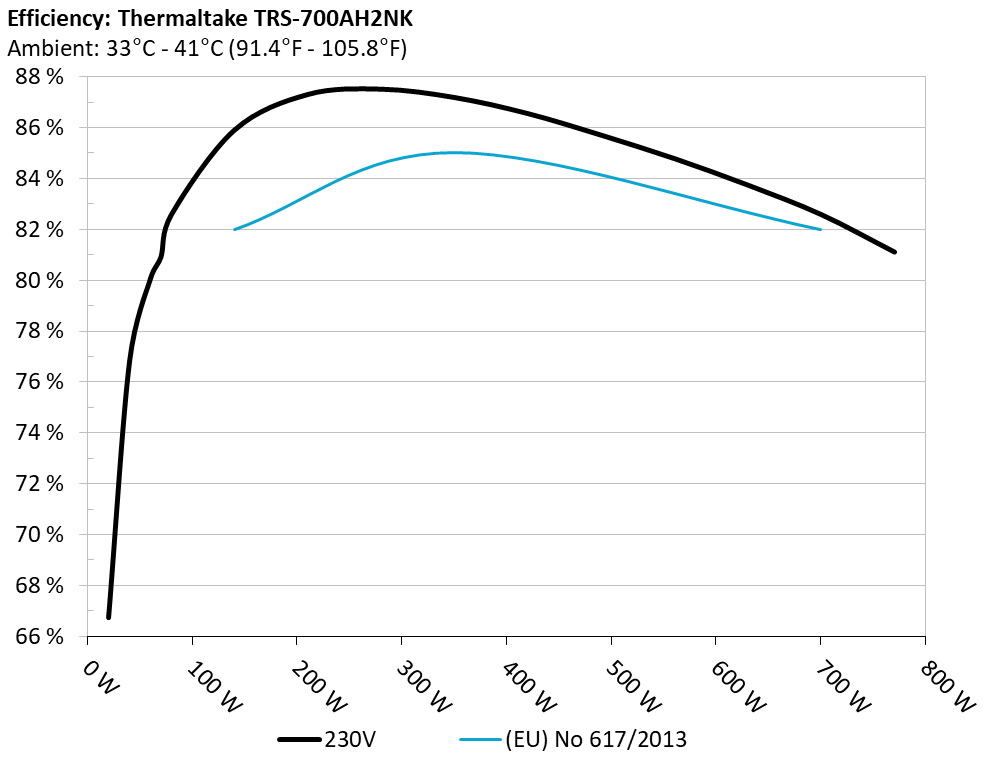
Efficiency under high ambient temperature
INFO
The PSU`s efficiency under high ambient temperatures with 115V and 230V input. For this graph the results of the 10-110% load regulation table are used
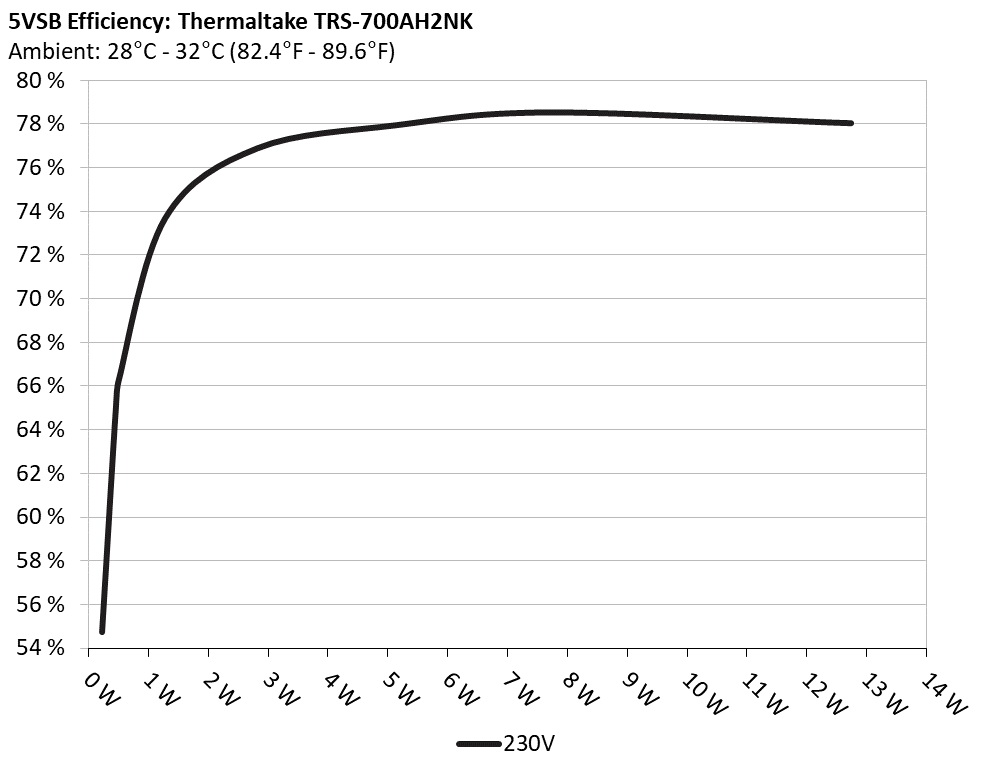
5VSB Efficiency
INFO
This graph depicts the efficiency levels of the 5VSB rail with 115V and 230V input
5VSB Efficiency (ERP LOT 3/6 & CEC) 230V
Test #
5VSB
DC/AC (Watts)
Efficiency
PF/AC Volts
1
0.045A
0.232
54.717%
0.026
5.156V
0.424
230.37V
2
0.090A
0.464
65.077%
0.043
5.155V
0.713
230.37V
3
0.550A
2.830
76.881%
0.182
5.144V
3.681
230.36V
4
1.000A
5.134
77.930%
0.256
5.133V
6.588
230.36V
5
1.500A
7.683
78.518%
0.300
5.121V
9.785
230.36V
6
2.501A
12.743
78.025%
0.346
5.096V
16.332
230.36V
Protection Features
Supplementary Tests (For Reference)
Typical Load Tests 230V
Test #
12V
5V
3.3V
5VSB
DC/AC (Watts)
Efficiency
Fan Speed (RPM)
PSU Noise (dB[A])
Temps (In/Out)
PF/AC Volts
1
4.003A
1.937A
1.954A
0.978A
70.008
80.904%
1034
28.8
34.97°C
0.893
12.092V
5.164V
3.378V
5.114V
86.532
36.80°C
230.39V
2
9.049A
2.914A
2.943A
1.178A
140.050
85.891%
1141
31.5
35.33°C
0.934
12.061V
5.150V
3.365V
5.093V
163.055
37.48°C
230.39V
3
14.489A
3.404A
3.442A
1.380A
210.056
87.293%
1332
35.6
36.76°C
0.948
12.009V
5.144V
3.354V
5.074V
240.633
39.23°C
230.40V
4
19.974A
3.895A
3.949A
1.583A
280.061
87.500%
1472
38.5
36.86°C
0.956
11.958V
5.137V
3.343V
5.054V
320.068
39.86°C
230.38V
5
25.109A
4.883A
4.955A
1.789A
350.060
87.174%
1612
40.6
37.08°C
0.962
11.930V
5.121V
3.330V
5.033V
401.566
40.89°C
230.38V
6
30.264A
5.878A
5.970A
1.997A
420.017
86.542%
1756
42.8
38.23°C
0.965
11.902V
5.105V
3.317V
5.010V
485.335
42.31°C
230.36V
7
35.480A
6.878A
6.992A
2.207A
490.152
85.694%
1879
44.3
38.76°C
0.969
11.867V
5.089V
3.304V
4.987V
571.982
43.34°C
230.38V
8
40.733A
7.888A
8.027A
2.419A
560.290
84.766%
1892
44.6
39.01°C
0.972
11.830V
5.073V
3.289V
4.962V
660.988
44.51°C
230.38V
9
46.517A
8.393A
8.546A
2.429A
630.016
83.731%
1894
44.7
39.27°C
0.975
11.770V
5.065V
3.276V
4.942V
752.431
45.39°C
230.34V
10
52.367A
8.905A
9.107A
2.542A
700.338
82.567%
1881
44.4
39.44°C
0.978
11.708V
5.056V
3.261V
4.919V
848.210
46.47°C
230.35V
11
58.722A
8.905A
9.142A
2.551A
769.981
81.099%
1882
44.4
40.61°C
0.981
11.627V
5.055V
3.249V
4.901V
949.432
48.53°C
230.41V
CL1
0.119A
14.001A
14.000A
0.002A
114.803
74.553%
2010
45.9
37.47°C
0.938
13.309V
4.748V
3.338V
5.081V
153.988
41.06°C
230.37V
CL2
54.020A
1.000A
1.000A
1.000A
619.765
83.657%
1836
43.6
39.65°C
0.975
11.222V
5.255V
3.295V
5.002V
740.840
46.81°C
230.35V
The results above are not used in the certification process
Light Load Tests 230V
Test #
12V
5V
3.3V
5VSB
DC/AC (Watts)
Efficiency
Fan Speed (RPM)
PSU Noise (dB[A])
PF/AC Volts
1
1.227A
0.482A
0.487A
0.194A
19.996
66.731%
1030
28.7
0.731
12.101V
5.184V
3.391V
5.147V
29.965
230.38V
2
2.456A
0.965A
0.972A
0.390A
39.987
76.808%
1026
28.5
0.829
12.090V
5.179V
3.387V
5.137V
52.061
230.38V
3
3.690A
1.449A
1.465A
0.585A
60.017
80.065%
1025
28.5
0.877
12.078V
5.174V
3.381V
5.127V
74.960
230.38V
4
4.916A
1.935A
1.954A
0.782A
79.967
82.573%
1038
29.0
0.904
12.077V
5.166V
3.377V
5.117V
96.844
230.38V
The results above are not used in the certification process
Ripple Measurements 230V
Test
12V
5V
3.3V
5VSB
Pass/Fail
10% Load
9.10mV
4.60mV
6.70mV
6.00mV
Pass
20% Load
11.10mV
5.10mV
7.30mV
6.60mV
Pass
30% Load
13.00mV
5.70mV
7.50mV
7.70mV
Pass
40% Load
14.10mV
6.70mV
8.00mV
8.60mV
Pass
50% Load
16.60mV
8.30mV
9.80mV
9.60mV
Pass
60% Load
22.00mV
9.00mV
9.90mV
10.10mV
Pass
70% Load
24.10mV
10.40mV
9.90mV
15.90mV
Pass
80% Load
27.70mV
11.40mV
18.50mV
21.20mV
Pass
90% Load
32.40mV
14.70mV
21.70mV
29.90mV
Pass
100% Load
46.00mV
20.60mV
25.70mV
34.00mV
Pass
110% Load
53.90mV
22.10mV
29.20mV
43.70mV
Pass
Crossload1
13.80mV
75.30mV
23.70mV
16.70mV
Fail
Crossload2
45.60mV
12.60mV
18.20mV
17.00mV
Pass
The results above are not used in the certification process
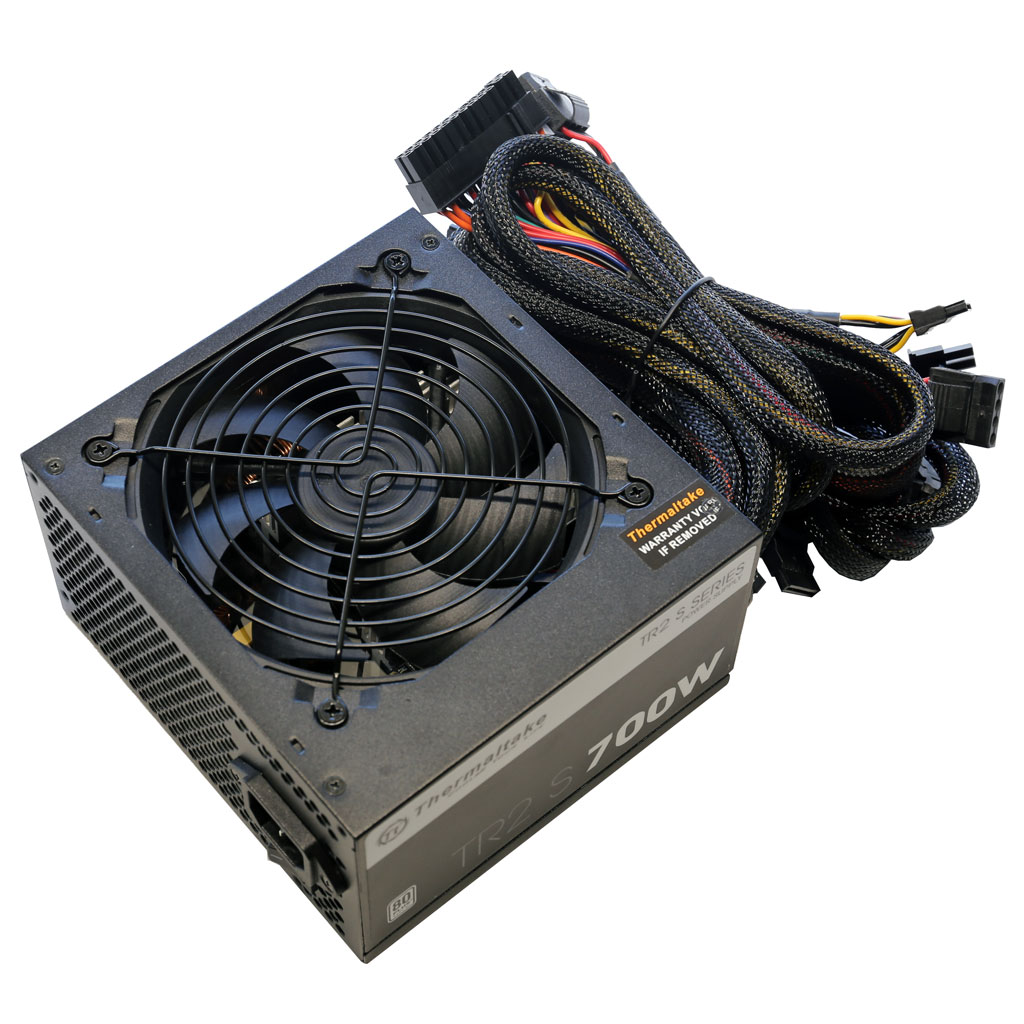
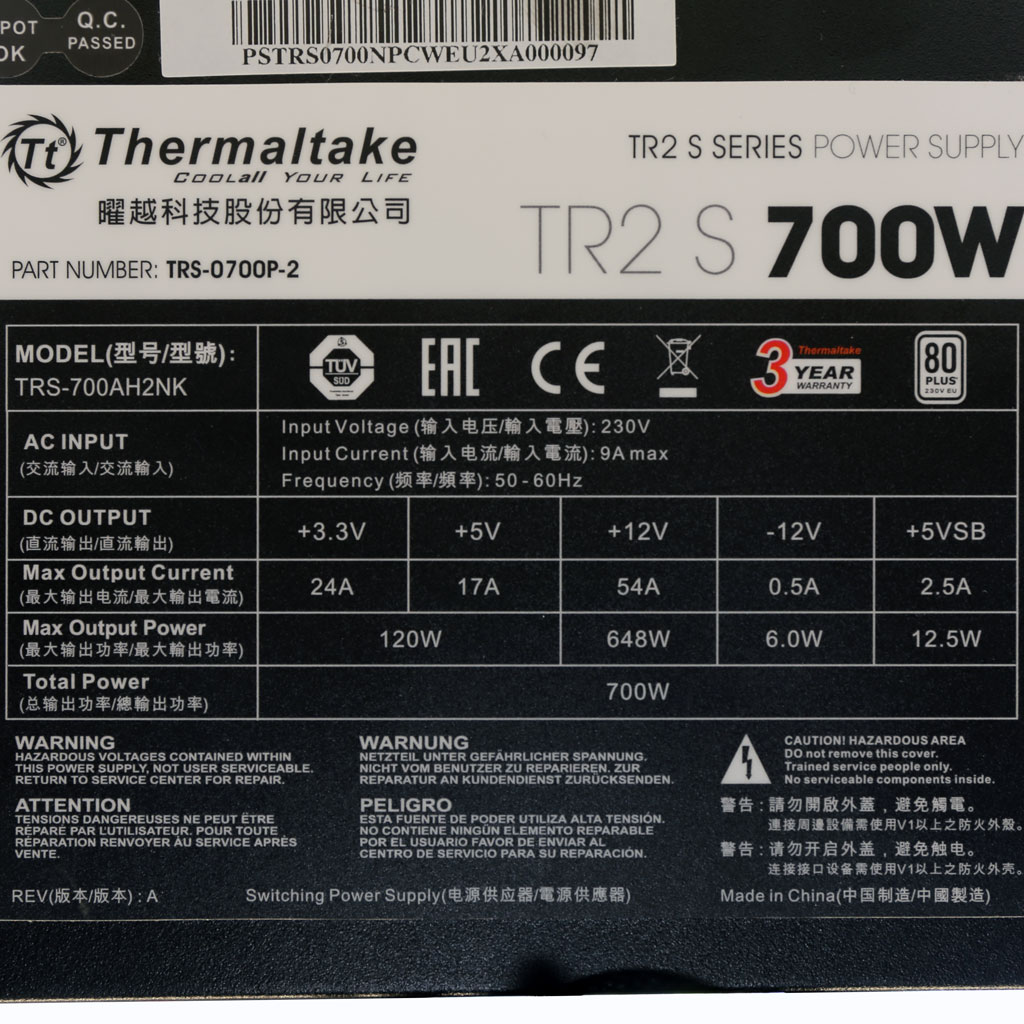
Thermaltake TR2 S 700W
Top side
Power specifications label
ybenetics bietet die freiwilligen ETA- und Lambda-Zertifizierungsprogramme an, mit denen effiziente und leise Netzteile (PSU) beworben werden