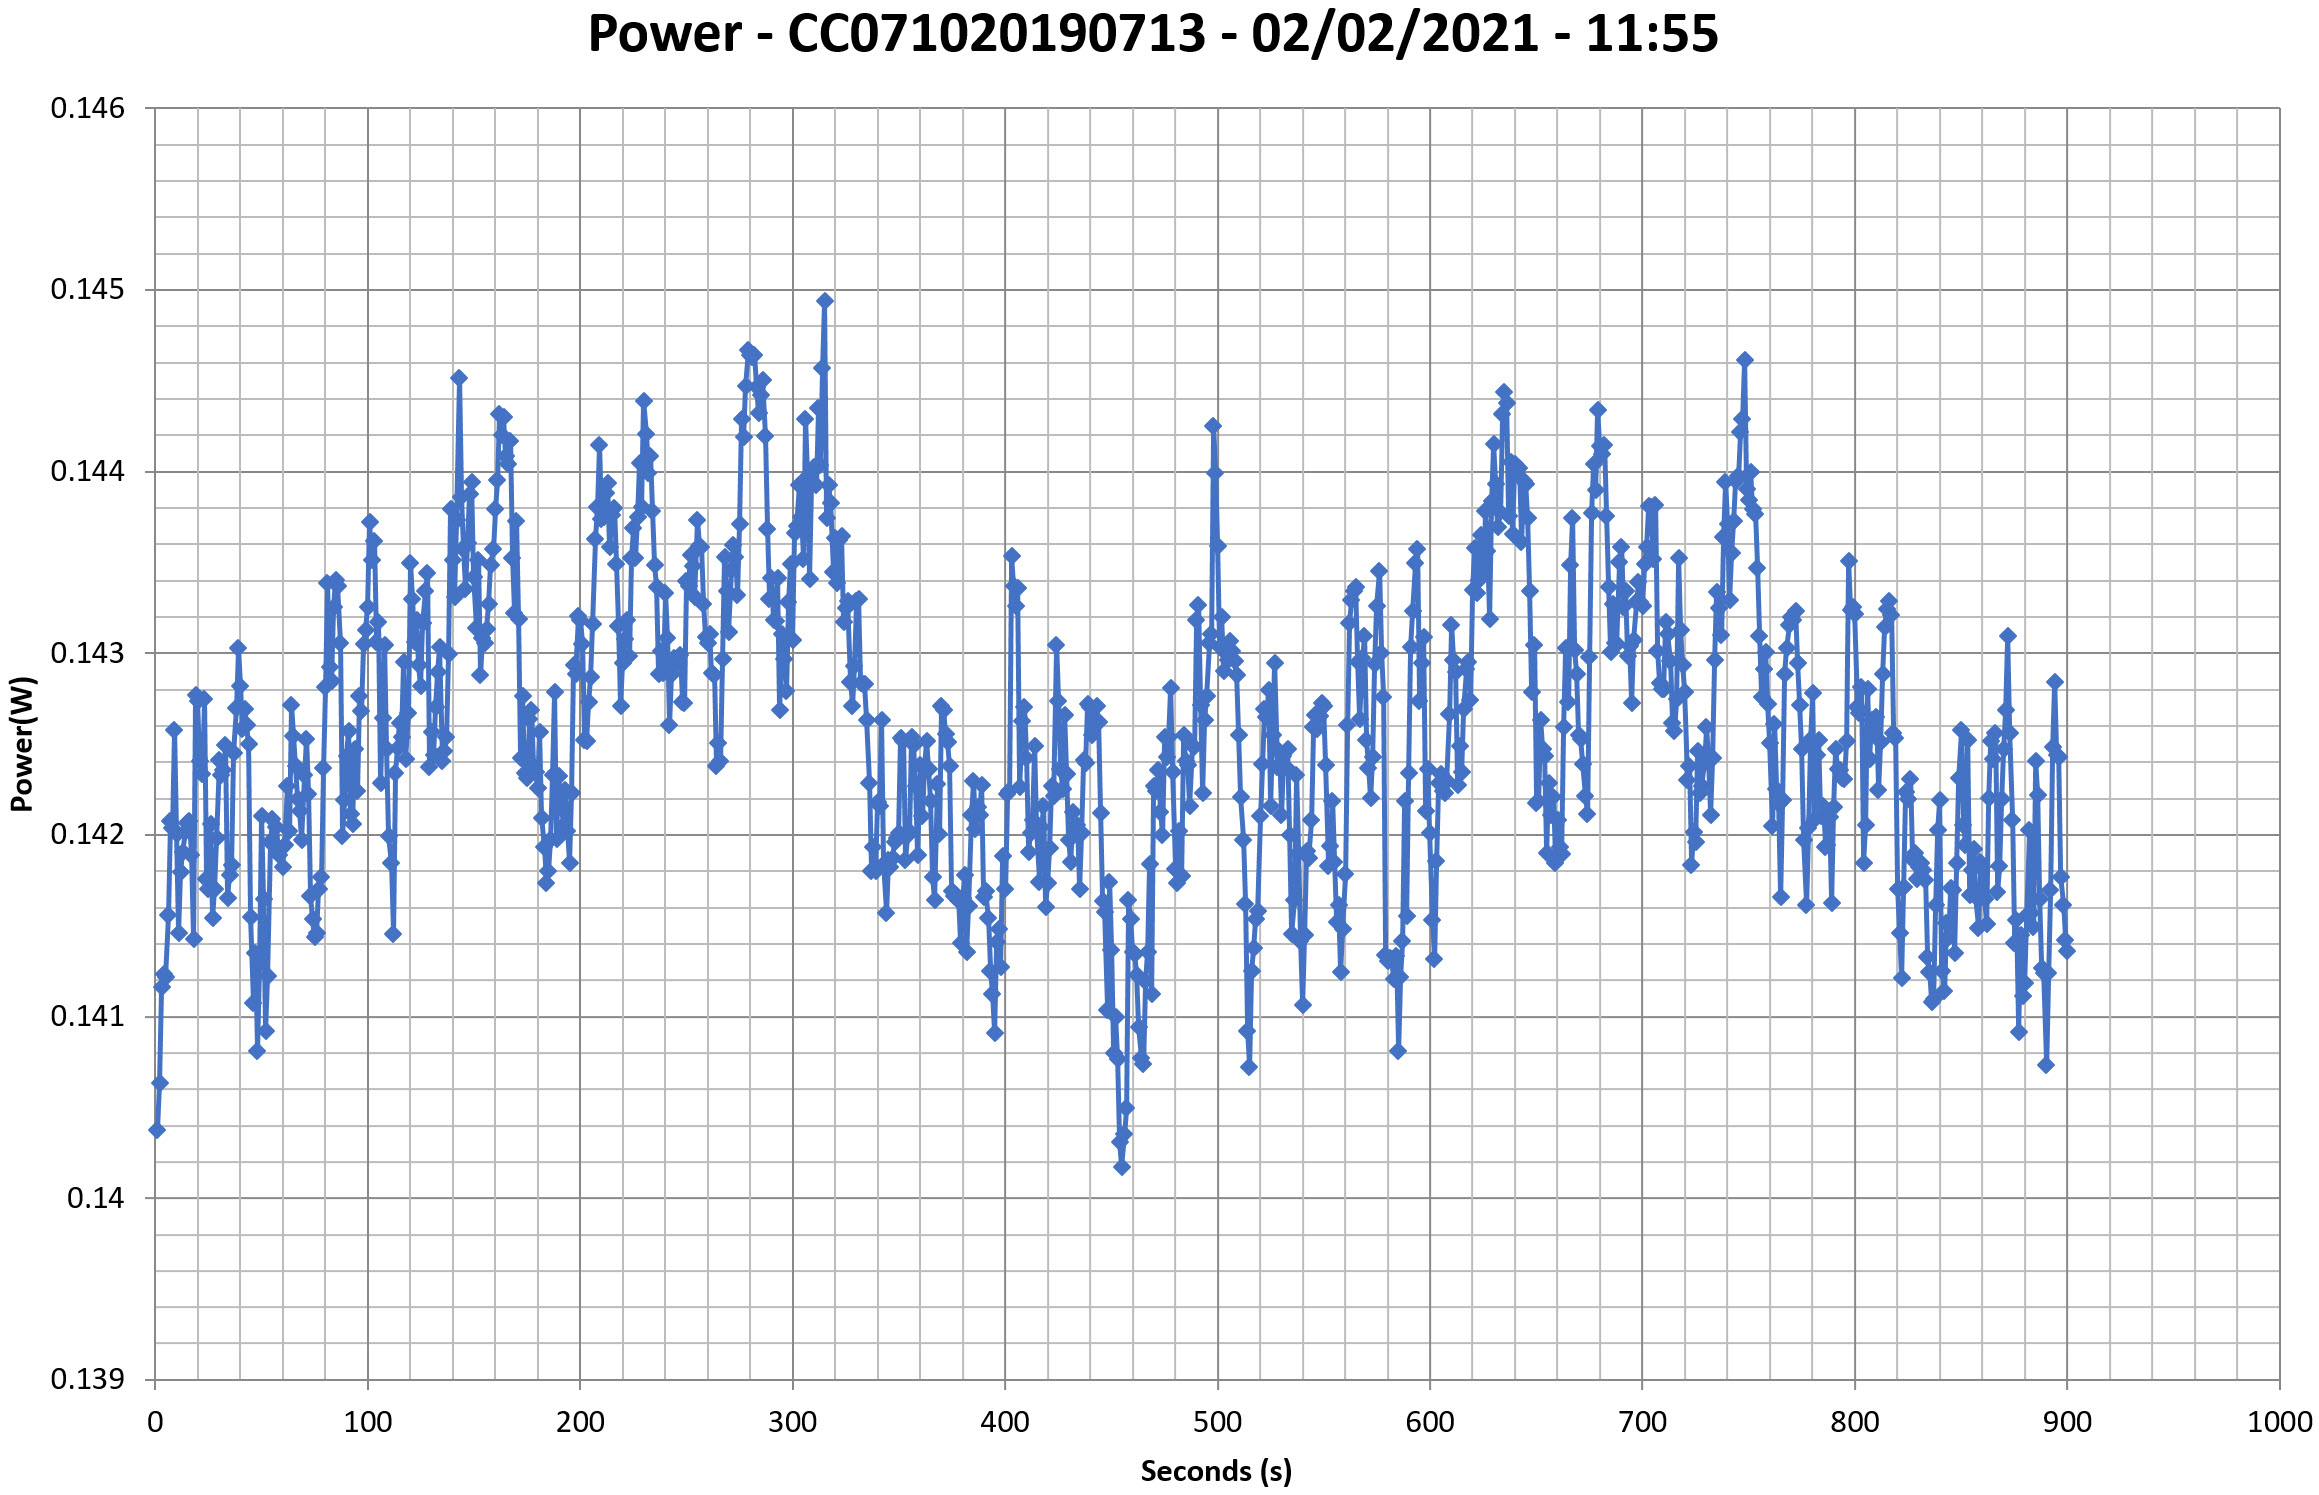
This graph is generated by the PPA Standby Power Analysis software which takes full control of the power analyzer during the whole procedure. This application features all of the EN50564 & IEC62301 test limits for standby power software testing
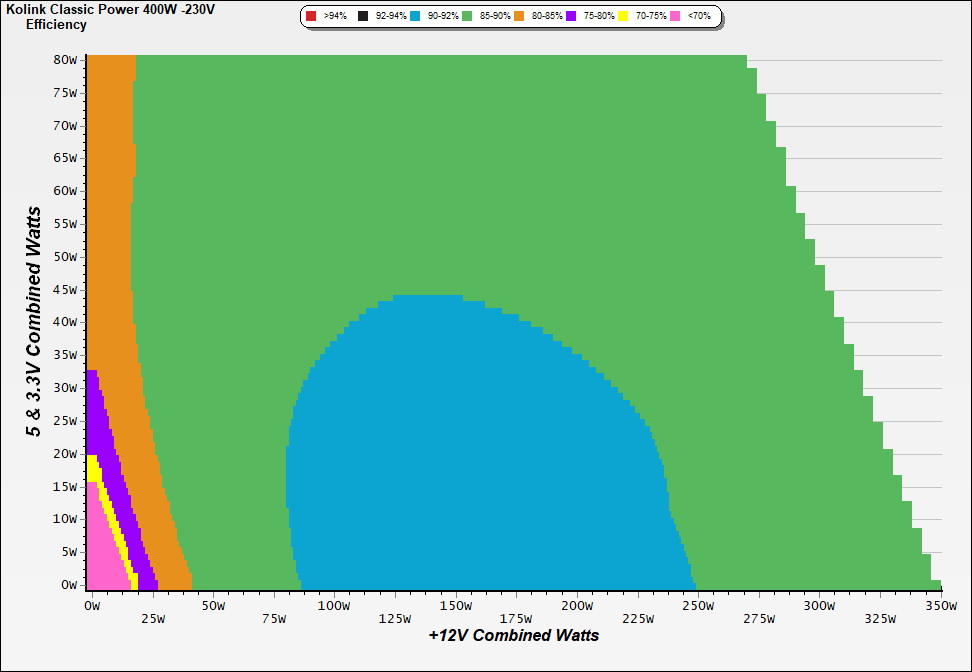
Efficiency Graph
230V
INFO
This graph depicts the PSU`s efficiency throughout its entire operational range. For the generation of the efficiency and noise graphs we set our loaders to auto mode through our custom-made software before trying thousands of possible load combinations
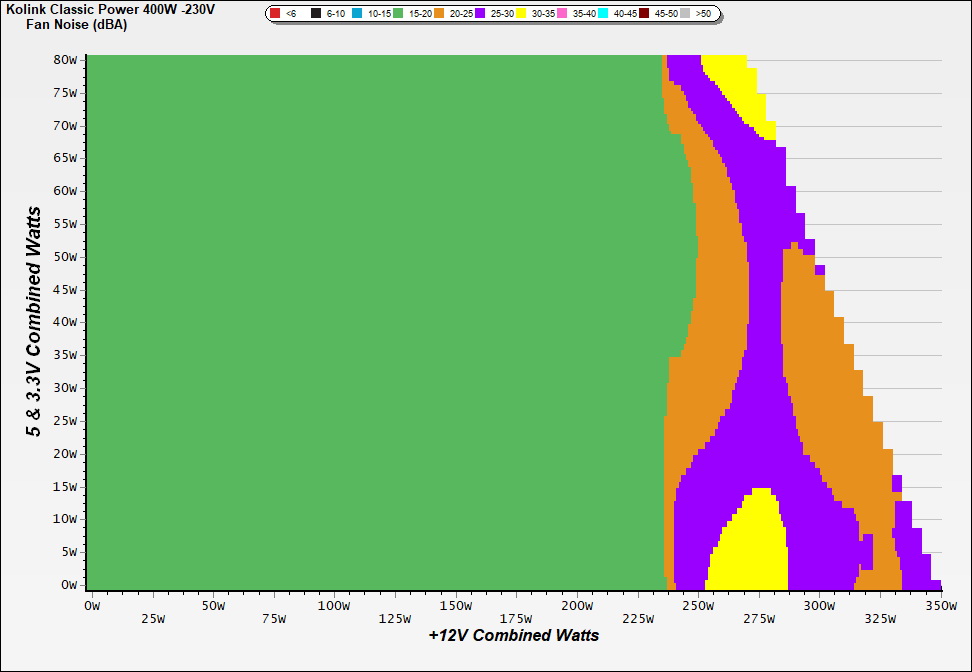
Noise Graph
230V
INFO
The PSU`s noise in its entire operational range and under 30-32 °C ambient is depicted in this graph. The X axis represents the load on the +12V rail(s) while the Y axis is the load on the minor rails
Conducted Emissions EN55032 & CISPR 32
Indicative Performance
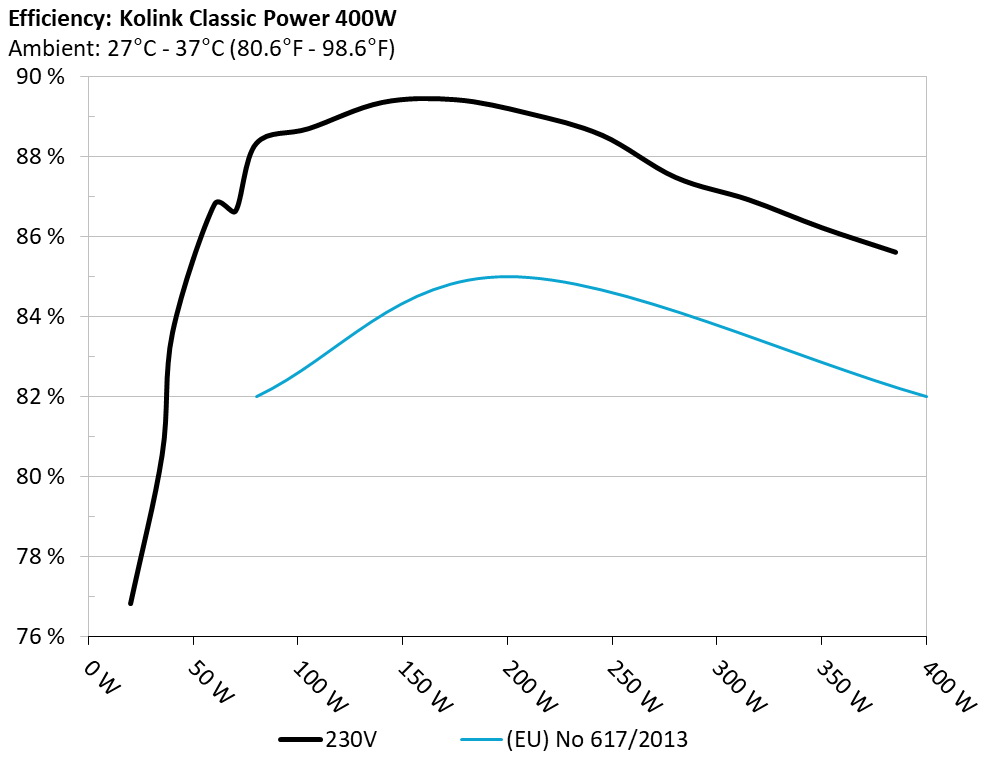
Efficiency under high ambient temperature
INFO
The PSU`s efficiency under high ambient temperatures with 115V and 230V input. For this graph the results of the 10-110% load regulation table are used
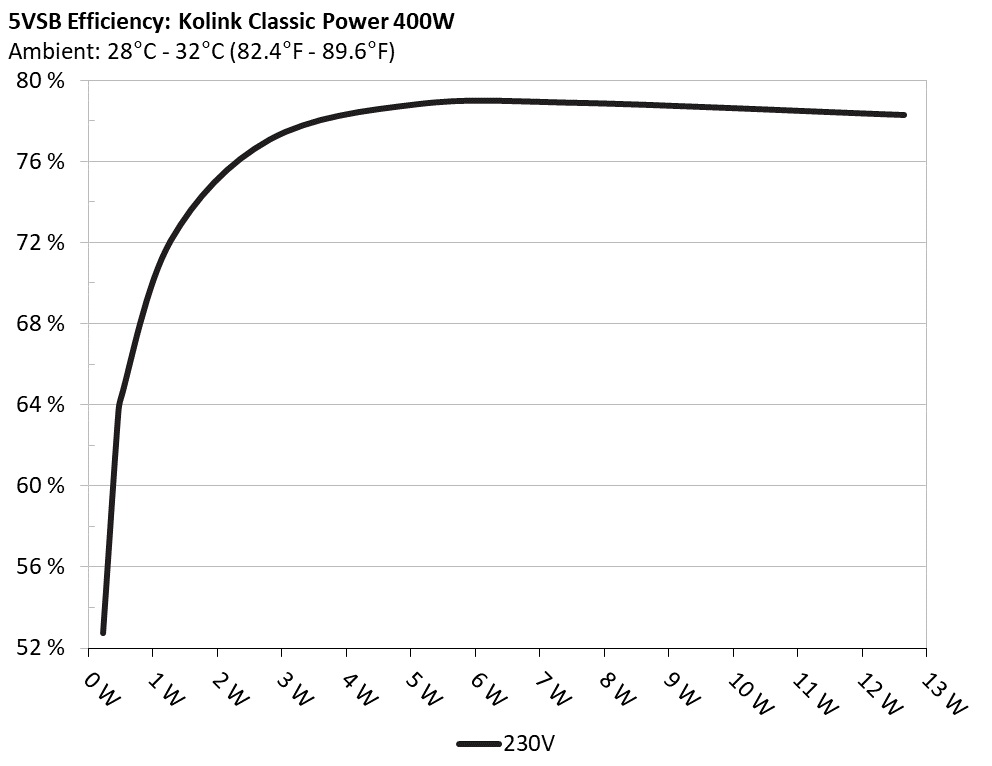
5VSB Efficiency
INFO
This graph depicts the efficiency levels of the 5VSB rail with 115V and 230V input
5VSB Efficiency (ERP LOT 3/6 & CEC) 230V
Test #
5VSB
DC/AC (Watts)
Efficiency
PF/AC Volts
1
0.045A
0.230
52.752%
0.013
5.122V
0.436
230.23V
2
0.090A
0.461
63.411%
0.022
5.120V
0.727
230.24V
3
0.550A
2.810
77.071%
0.102
5.108V
3.646
230.22V
4
1.000A
5.097
78.816%
0.167
5.097V
6.467
230.22V
5
1.500A
7.627
78.881%
0.225
5.084V
9.669
230.22V
6
2.500A
12.644
78.286%
0.301
5.057V
16.151
230.22V
Protection Features
Supplementary Tests (For Reference)
Typical Load Tests 230V
Test #
12V
5V
3.3V
5VSB
DC/AC (Watts)
Efficiency
Fan Speed (RPM)
PSU Noise (dB[A])
Temps (In/Out)
PF/AC Volts
1
1.102A
1.973A
1.951A
0.983A
35.046
80.541%
853
19.1
30.09°C
0.642
12.203V
5.066V
3.384V
5.087V
43.513
33.67°C
230.24V
2
3.208A
2.966A
2.930A
1.183A
70.027
86.633%
855
19.3
30.54°C
0.823
12.193V
5.060V
3.380V
5.072V
80.832
34.52°C
230.23V
3
5.663A
3.459A
3.422A
1.384A
105.030
88.700%
858
19.1
31.01°C
0.898
12.182V
5.056V
3.376V
5.059V
118.410
35.80°C
230.24V
4
8.118A
3.960A
3.915A
1.586A
140.027
89.354%
865
19.3
31.77°C
0.934
12.172V
5.052V
3.373V
5.046V
156.711
37.20°C
230.24V
5
10.234A
4.956A
4.898A
1.789A
175.017
89.424%
870
19.0
32.23°C
0.952
12.166V
5.046V
3.369V
5.031V
195.716
38.32°C
230.24V
6
12.356A
5.950A
5.885A
1.994A
210.007
89.079%
874
19.0
32.47°C
0.964
12.155V
5.044V
3.366V
5.015V
235.754
39.56°C
230.24V
7
14.489A
6.945A
6.867A
2.201A
245.089
88.533%
907
20.1
33.40°C
0.972
12.145V
5.042V
3.364V
4.999V
276.833
41.12°C
230.25V
8
16.618A
7.946A
7.856A
2.409A
280.075
87.481%
1350
32.2
33.94°C
0.977
12.134V
5.037V
3.361V
4.983V
320.154
42.04°C
230.24V
9
19.183A
8.449A
8.339A
2.413A
315.018
86.921%
1553
35.9
34.30°C
0.981
12.120V
5.033V
3.357V
4.974V
362.419
43.30°C
230.24V
10
21.711A
8.951A
8.855A
2.521A
350.098
86.220%
1722
39.2
34.50°C
0.983
12.108V
5.029V
3.354V
4.961V
406.053
44.40°C
230.24V
11
24.640A
8.956A
8.862A
2.525A
385.163
85.608%
1858
41.5
36.88°C
0.986
12.092V
5.026V
3.351V
4.953V
449.916
47.72°C
230.24V
CL1
0.118A
10.002A
10.002A
0.000A
85.597
82.782%
910
20.1
32.65°C
0.878
12.209V
5.043V
3.371V
5.078V
103.401
38.88°C
230.25V
CL2
29.008A
1.001A
1.000A
1.000A
363.665
87.931%
1488
34.8
34.69°C
0.984
12.073V
5.056V
3.368V
5.022V
413.580
44.66°C
230.25V
The results above are not used in the certification process
Light Load Tests 230V
Test #
12V
5V
3.3V
5VSB
DC/AC (Watts)
Efficiency
Fan Speed (RPM)
PSU Noise (dB[A])
PF/AC Volts
1
1.215A
0.494A
0.486A
0.196A
19.994
76.820%
850
19.0
0.476
12.212V
5.074V
3.389V
5.113V
26.027
230.24V
2
2.434A
0.986A
0.974A
0.392A
39.985
83.598%
852
19.1
0.675
12.197V
5.070V
3.386V
5.103V
47.830
230.24V
3
3.656A
1.481A
1.461A
0.589A
60.016
86.806%
849
19.0
0.784
12.191V
5.066V
3.383V
5.093V
69.138
230.24V
4
4.872A
1.976A
1.951A
0.787A
79.967
88.328%
853
19.1
0.850
12.185V
5.063V
3.381V
5.083V
90.534
230.24V
The results above are not used in the certification process
Ripple Measurements 230V
Test
12V
5V
3.3V
5VSB
Pass/Fail
10% Load
11.40mV
13.50mV
17.60mV
5.70mV
Pass
20% Load
11.10mV
15.50mV
17.90mV
5.90mV
Pass
30% Load
13.70mV
16.10mV
18.80mV
6.10mV
Pass
40% Load
14.20mV
12.80mV
18.00mV
6.70mV
Pass
50% Load
18.50mV
9.50mV
18.80mV
7.50mV
Pass
60% Load
18.10mV
9.00mV
18.70mV
8.30mV
Pass
70% Load
20.90mV
9.50mV
24.30mV
11.00mV
Pass
80% Load
21.00mV
10.60mV
32.10mV
12.80mV
Pass
90% Load
21.20mV
12.50mV
30.00mV
15.90mV
Pass
100% Load
22.50mV
14.80mV
30.50mV
17.30mV
Pass
110% Load
24.40mV
15.40mV
24.40mV
17.60mV
Pass
Crossload1
16.10mV
19.90mV
21.00mV
11.90mV
Pass
Crossload2
22.20mV
10.00mV
20.50mV
13.40mV
Pass
The results above are not used in the certification process
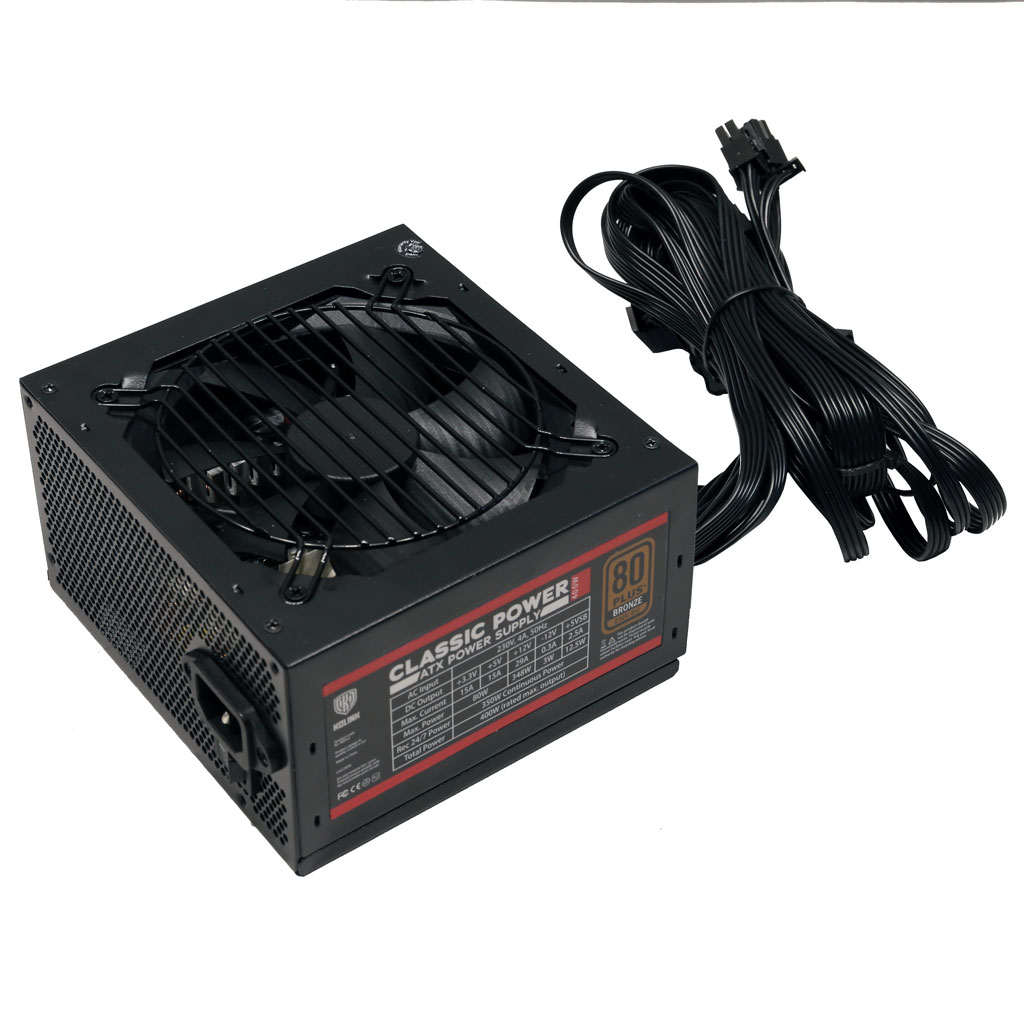
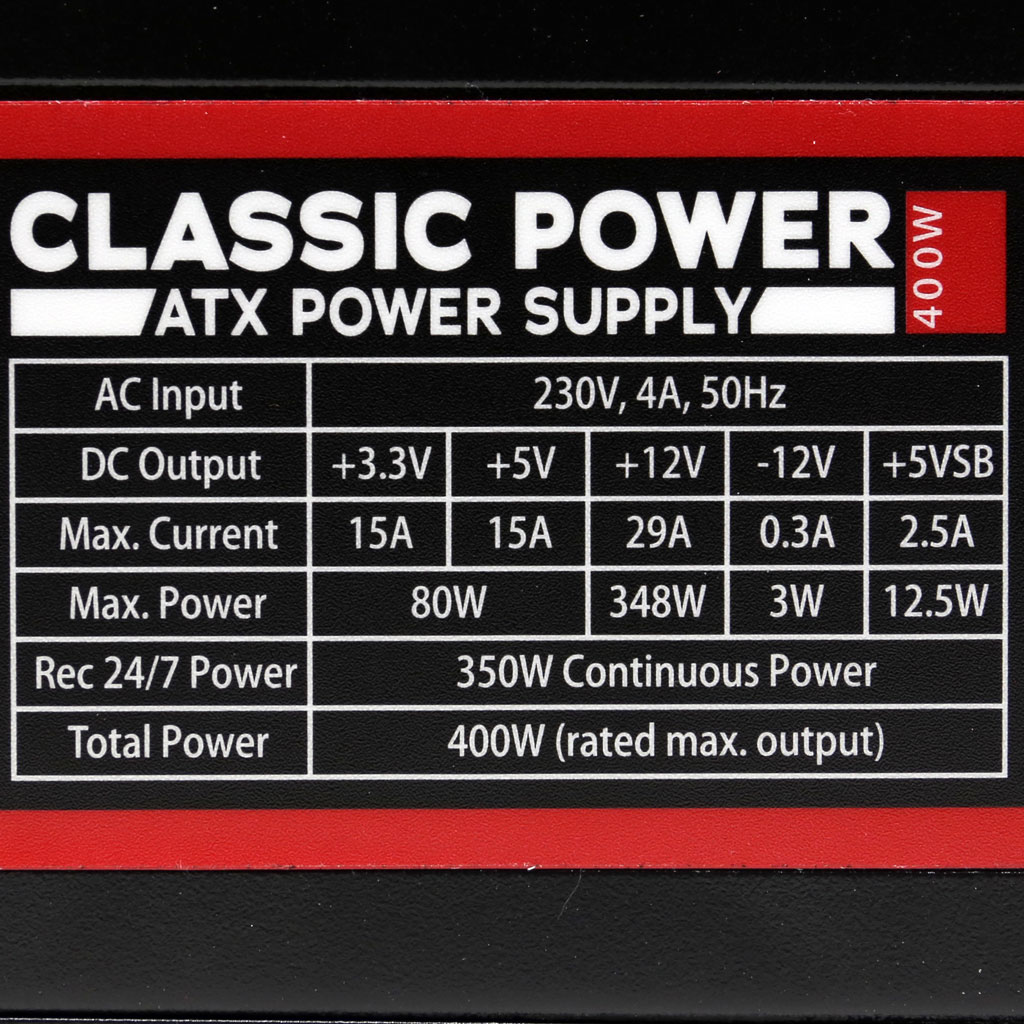
Kolink Classic Power 400W
Top side
Power specifications label
All data and graphs included in this test report can be used by any individual on the following conditions: › It should be mentioned that the test results are provided by Cybenetics › The link to the original test results document should be provided in any case
Cybenetics offers the ETA and Lambda voluntary certification programs, through which the efficient and silent power supplies are promoted