| 115V | 230V | |
| Scheme: ETA-EMI PSU |  |
 |
| 115V | 230V | |
 |
 |
Scheme: LAMBDA PSU |
 Outside Validation Scope

| Product Identification Details | |
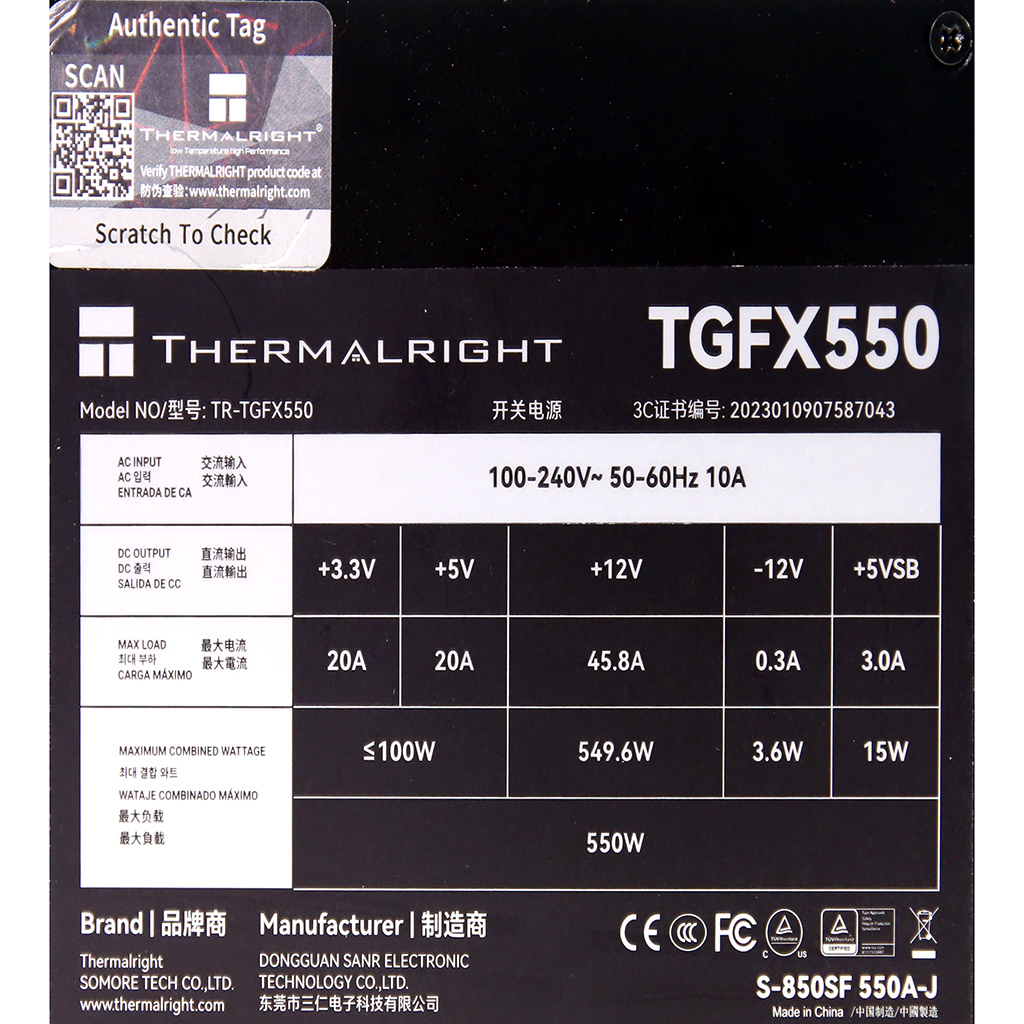
| Brand | Thermalright |
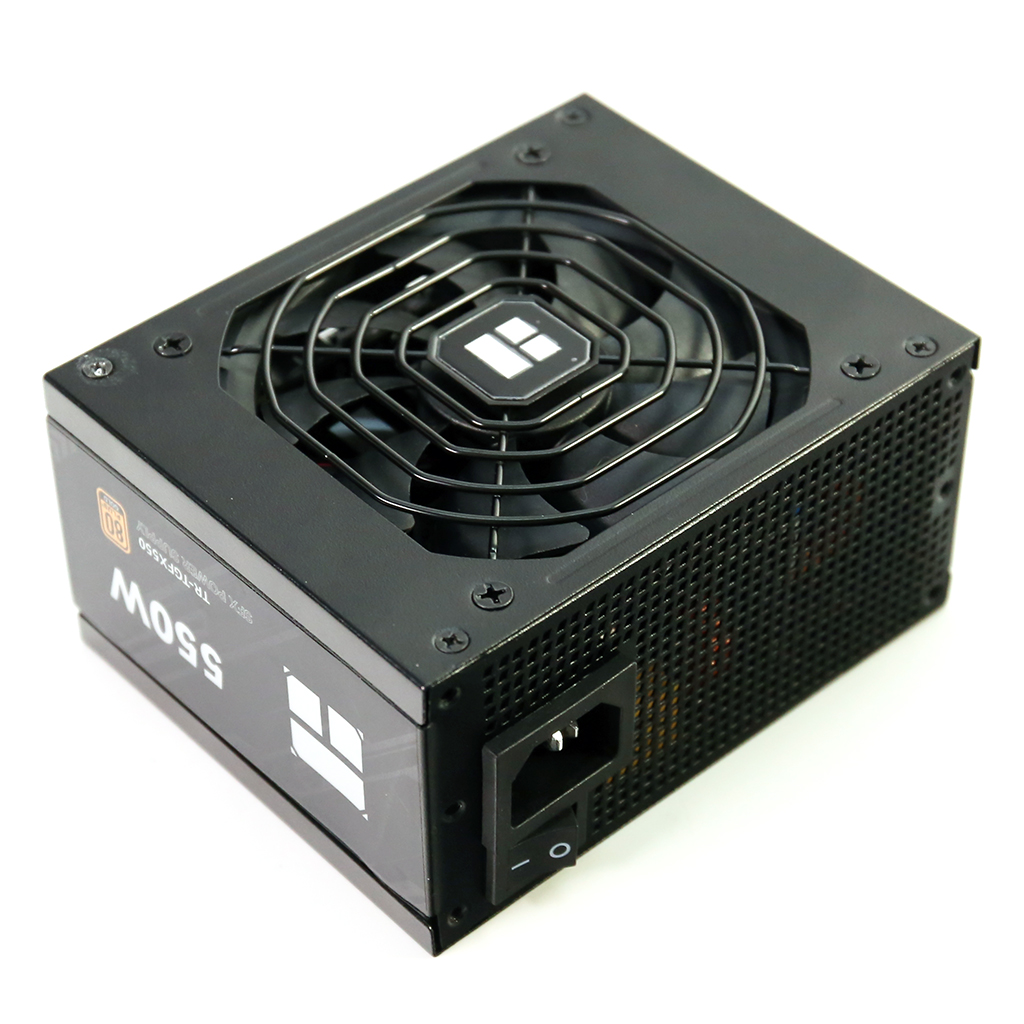
| Model | TR-TGFX550 |
| OEM | SANR |
| Serial Number | 2023010907587043 |
| Product Specifications | |
| Manufacturer | |
| Rated Voltage (Vrms) | 100-240 |
| Rated Current (Arms) | 10 |
| Rated Frequency (Hz) | 50-60 |
| Rated Power (W) | 550 |
| Operating Temperature (Continuous Full Load) (°C) | |
| Type | SFX |
| Cable Design | Fully Modular |
| Warranty | - |
| Cybenetics | |
| Dimensions (W x H x D) | |
| Weight | |
| Cooling | 92mm Ball Bearing Fan (D92PH-12B) |
| Semi-Passive Operation | ✓ |
| Cybenetics Testing Information | |
| Lab ID | TR55002494 |
| Date of receipt | May 1, 2024 |
| Testing Date | Jul 2, 2024 |
| Report Issued Date | Jul 4, 2024 |
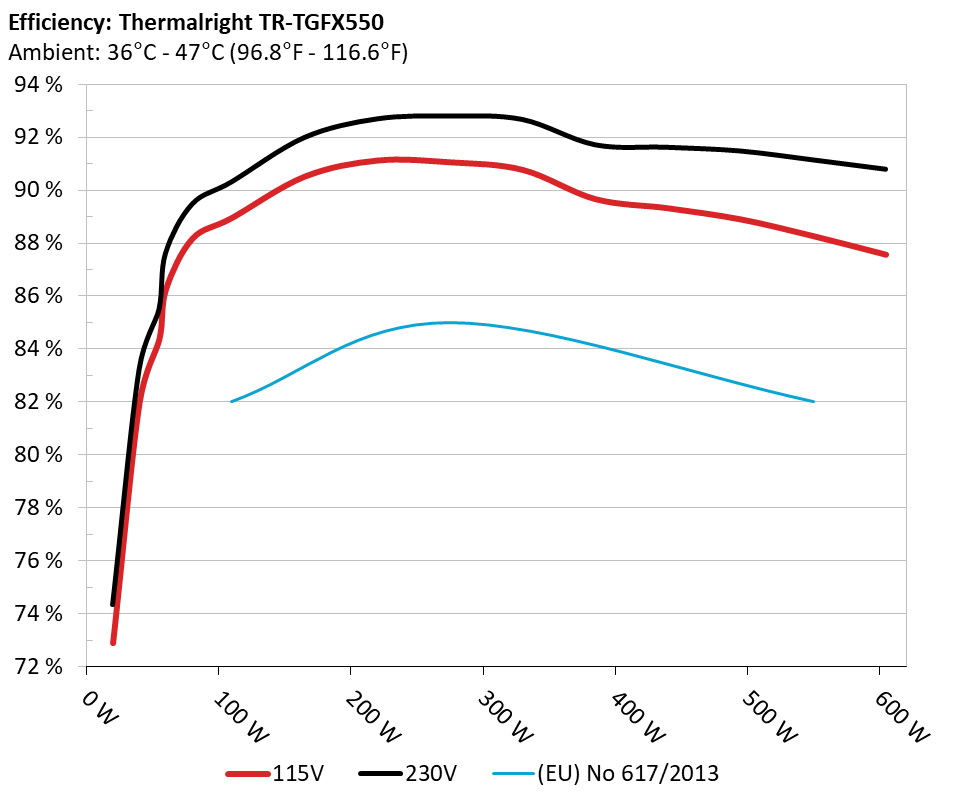
| DUT Notes | It drops category at 230V because of the low PF and the increased standby power. |
| Engineer Name | - |
| Authorized By the Laboratory Technical Manager | Aristeidis Bitziopoulos |
| Signature | |