First Semiconductor FIR4N70L VDMOSFET (700V, 2.5A)
Test Results
Temperature & Compliance Info
Temperature Range (°C /°F)
30-32 / 86-89.6
ErP Lot 3/6 Ready
✓
(EU) No 617/2013 Compliance
✓
ALPM (Alternative Low Power Mode) compatible
✓
ATX v3.1 PSU Power Excursion
✓
Performance Summary
效率評比
GOLD
噪音評比
Standard++
Average Efficiency (>1450 load combinations)
88.531%
Average Noise Output (>1450 Load Combinations)
33.94dBA
Average PF (>1450 Load Combinations)
0.989
Efficiency With 10W (≤500W) or 2% (>500W) Load
64.681%
Standby Power Consumption
0.0550W
12V Ripple (Full Load)
29.52mV
5V Ripple (Full Load)
16.98mV
3.3V Ripple (Full Load)
16.67mV
5VSB Ripple (Full Load)
19.15mV
12V Load Regulation
0.10%
5V Load Regulation
1.75%
3.3V Load Regulation
3.33%
5VSB Load Regulation
2.81%
Inrush Current
53.690A
效率評比
GOLD
噪音評比
Standard++
Average Efficiency (>1450 load combinations)
90.600%
Average Noise Output (>1450 Load Combinations)
34.58dBA
Average PF (>1450 Load Combinations)
0.960
Efficiency With 10W (≤500W) or 2% (>500W) Load
62.376%
Standby Power Consumption
0.1251W
12V Ripple (Full Load)
30.63mV
5V Ripple (Full Load)
16.41mV
3.3V Ripple (Full Load)
15.52mV
5VSB Ripple (Full Load)
18.46mV
12V Load Regulation
0.09%
5V Load Regulation
1.79%
3.3V Load Regulation
3.36%
5VSB Load Regulation
2.85%
Inrush Current
94.850A
12V Transient Response (200%)
11.48V
5V Transient Response (200%)
4.965V
3.3V Transient Response (200%)
3.163V
5VSB Transient Response (200%)
4.940V
Hold-Up Time & Power Ok Signal
16.60ms
AC Loss to PWR_OK Hold Up Time
14.50ms
PWR_OK Inactive to DC Loss Delay
2.10ms
PSU Timings: T1 (20% / 100%)
123.0ms
126.0ms
PSU Timings: T3 (20% / 100%)
113.0ms
114.0ms
12V OCP (28.6°C / 44.2°C)
85.60A (158.23%), 12.158V
86.40A (159.70%), 12.168V
5V OCP (28.6°C / 44.2°C)
35.8A (179.00%), 5.046V
35.3A (176.50%), 5.047V
3.3V OCP (28.6°C / 44.2°C)
35.5A (177.50%), 3.275V
34.2A (171.00%), 3.274V
5VSB OCP (28.6°C / 44.2°C)
4A (160.00%), 5.019V
3.9A (156.00%), 5.017V
OPP (26.65°C / 44.78°C)
149.80%
149.80%
Hold-Up Time & Power Ok Signal
Hold-Up Time (ms)
16.6
AC Loss to PWR_OK Hold Up Time (ms)
14.5
PWR_OK Inactive to DC Loss Delay (ms)
2.1
待機電源消耗
Tables
Detailed Results
Average
Min
Limit Min
Max
Limit Max
Result
Mains Voltage RMS:
115.08 V
115.04 V
113.85 V
115.12 V
116.15 V
PASS
Mains Frequency:
60.00 Hz
59.99 Hz
59.40 Hz
60.01 Hz
60.60 Hz
PASS
Mains Voltage CF:
1.416
1.415
1.340
1.418
1.490
PASS
Mains Voltage THD:
0.13 %
0.09 %
N/A
0.19 %
2.00 %
PASS
Real Power:
0.055 W
0.004 W
N/A
0.090 W
N/A
N/A
Apparent Power:
3.739 W
3.620 W
N/A
3.844 W
N/A
N/A
Power Factor:
0.019
N/A
N/A
N/A
N/A
N/A
Detailed Results
Average
Min
Limit Min
Max
Limit Max
Result
Mains Voltage RMS:
231.04 V
230.92 V
227.70 V
231.09 V
232.30 V
PASS
Mains Frequency:
50.00 Hz
49.99 Hz
49.50 Hz
50.01 Hz
50.50 Hz
PASS
Mains Voltage CF:
1.417
1.416
1.340
1.419
1.490
PASS
Mains Voltage THD:
0.17 %
0.15 %
N/A
0.26 %
2.00 %
PASS
Real Power:
0.125 W
0.086 W
N/A
0.180 W
N/A
N/A
Apparent Power:
12.405 W
12.182 W
N/A
12.588 W
N/A
N/A
Power Factor:
0.011
N/A
N/A
N/A
N/A
N/A
Graphs
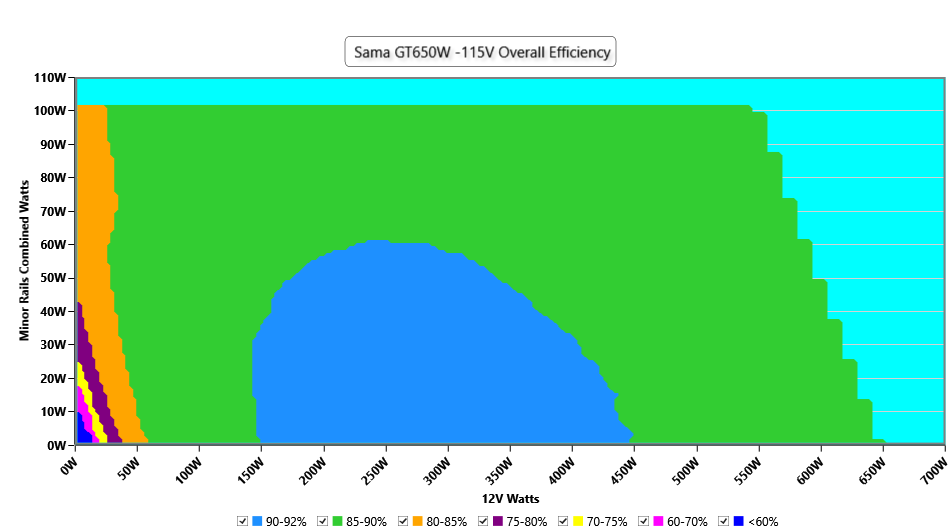
Efficiency Graph
INFO
This graph depicts the PSU`s efficiency throughout its entire operational range. For the generation of the efficiency and noise graphs we set our loaders to auto mode through our custom-made software before trying thousands of possible load combinations
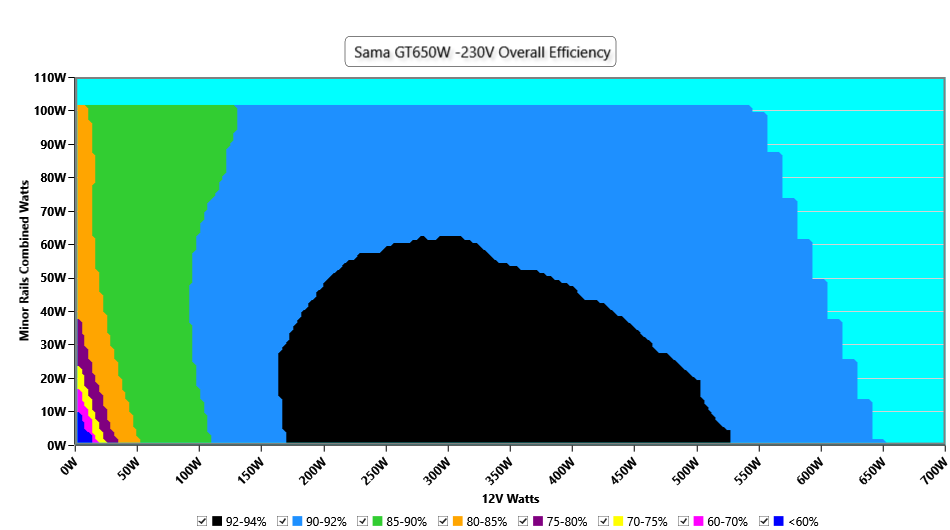
INFO
This graph depicts the PSU`s efficiency throughout its entire operational range. For the generation of the efficiency and noise graphs we set our loaders to auto mode through our custom-made software before trying thousands of possible load combinations
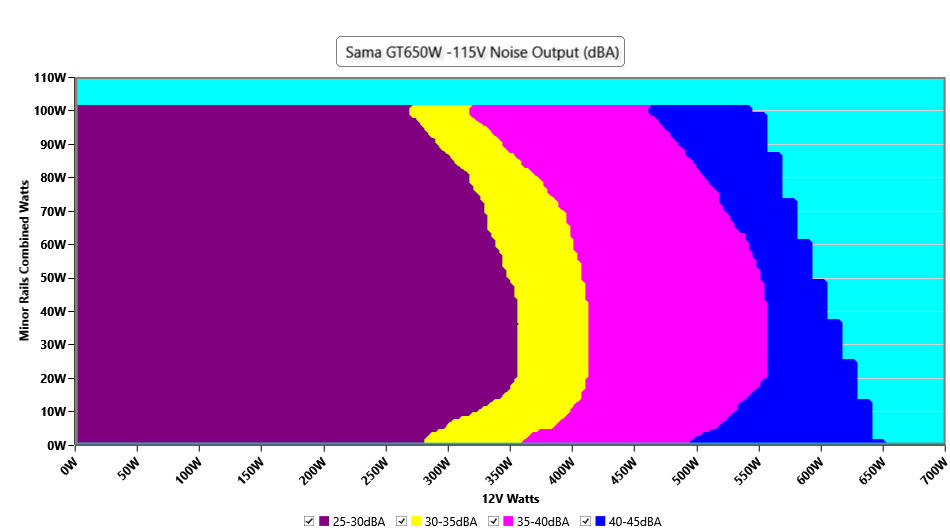
Noise Graph
INFO
The PSU`s noise in its entire operational range and under 30-32 °C ambient is depicted in this graph. The X axis represents the load on the +12V rail(s) while the Y axis is the load on the minor rails
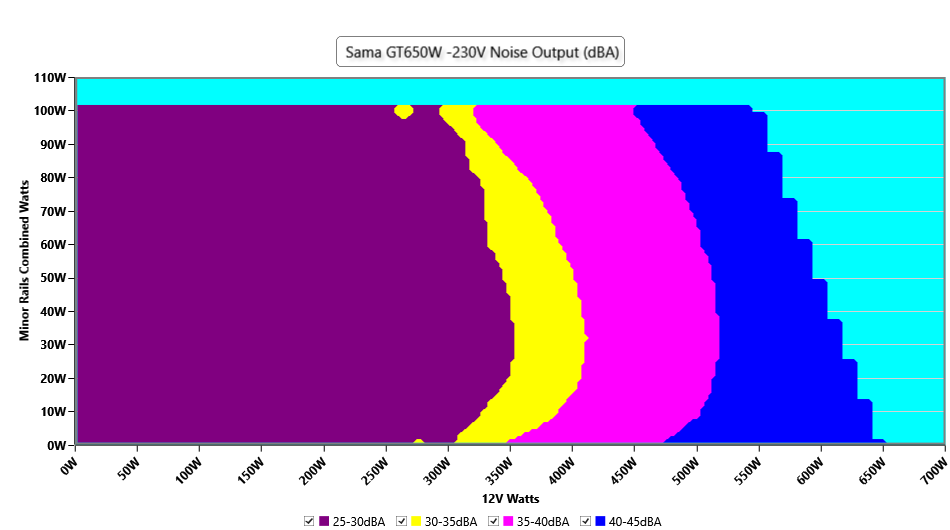
INFO
The PSU`s noise in its entire operational range and under 30-32 °C ambient is depicted in this graph. The X axis represents the load on the +12V rail(s) while the Y axis is the load on the minor rails
Conducted Emissions EN55032 & CISPR 32
Indicative Performance
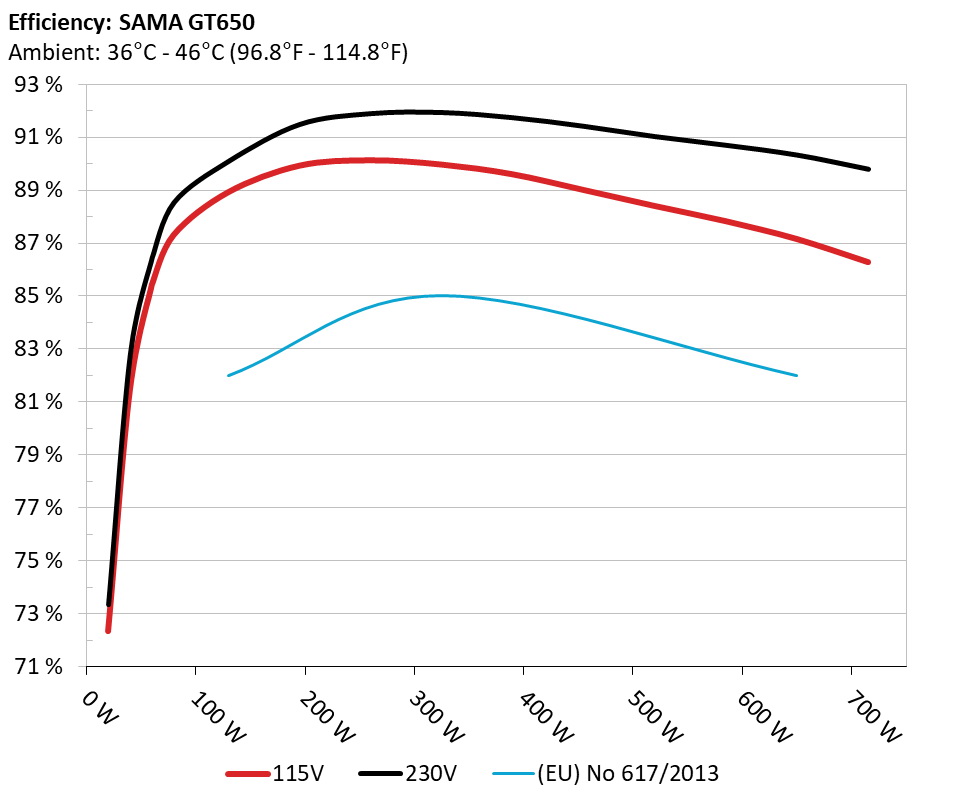
Efficiency under high ambient temperature
INFO
The PSU`s efficiency under high ambient temperatures with 115V and 230V input. For this graph the results of the 10-110% load regulation table are used
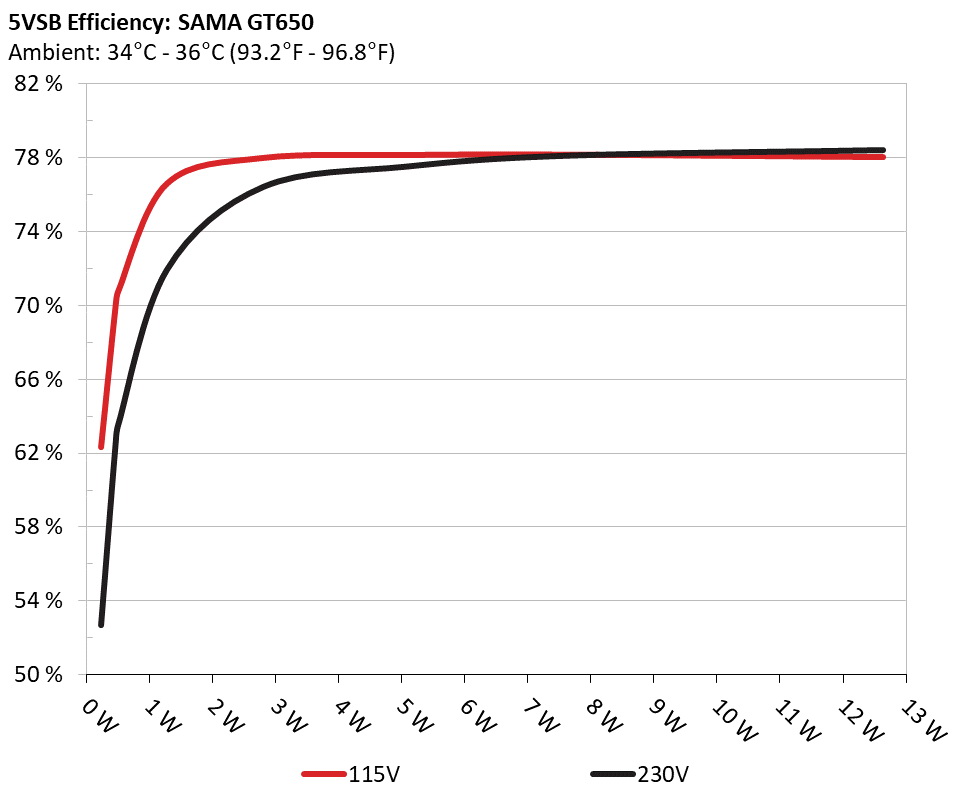
5VSB Efficiency
INFO
This graph depicts the efficiency levels of the 5VSB rail with 115V and 230V input


 Outside Validation Scope