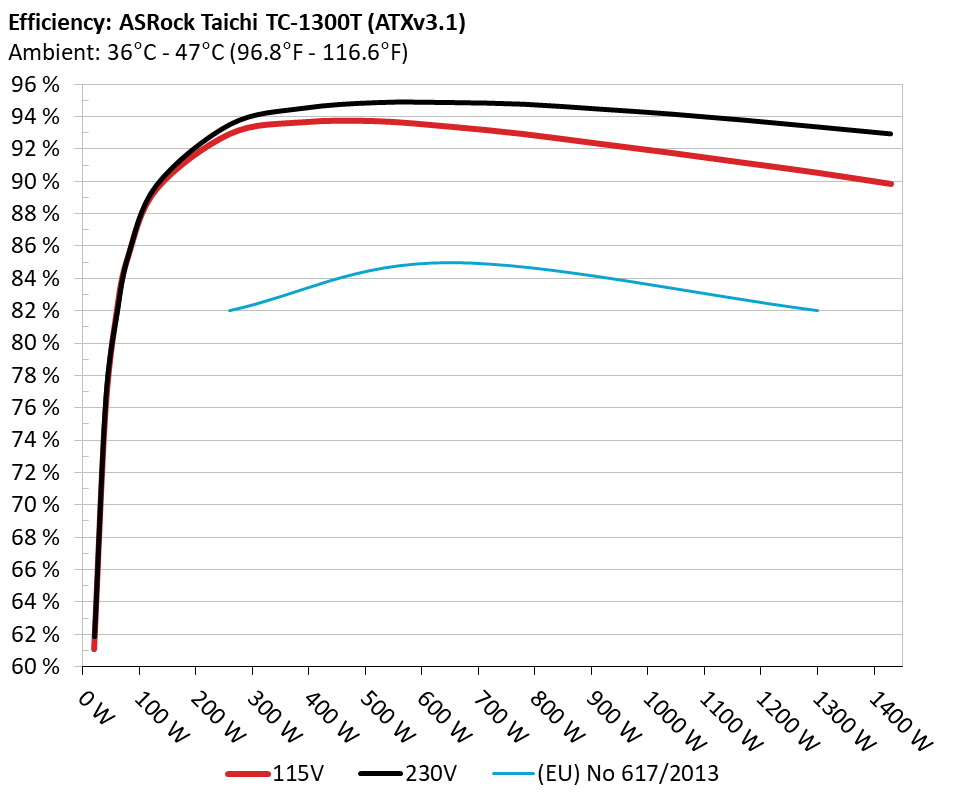
| 115V | 230V | |
| Scheme: ETA-EMI PSU |  |
 |
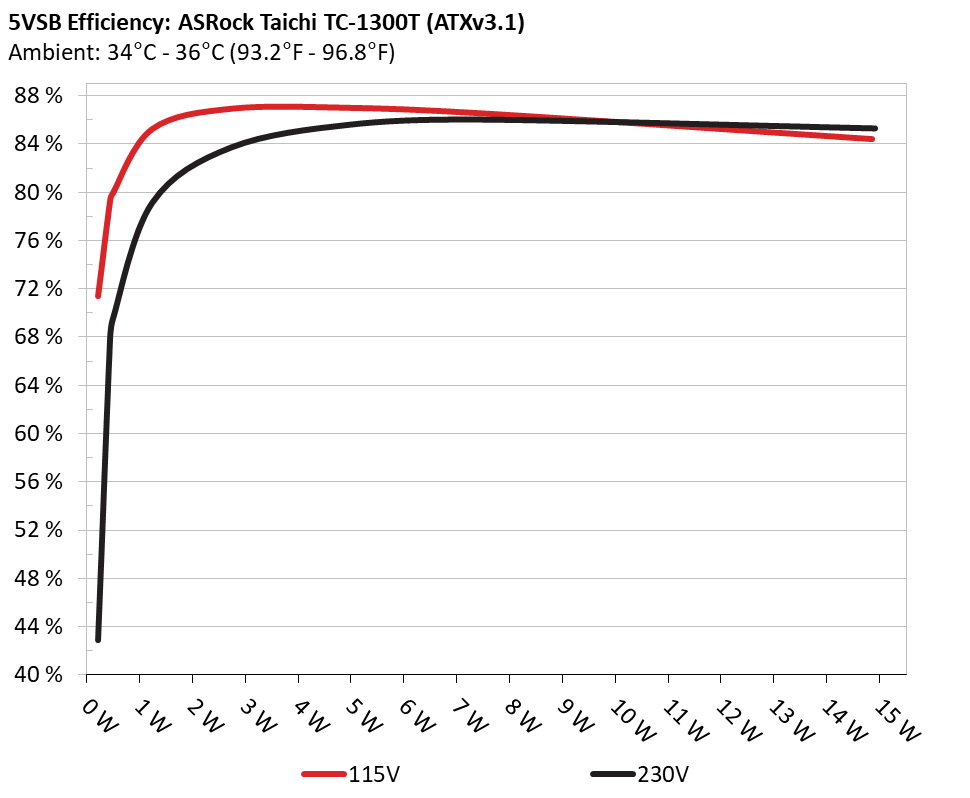
| 115V | 230V | |
 |
 |
Scheme: LAMBDA PSU |
 Outside Validation Scope

| Product Identification Details | |
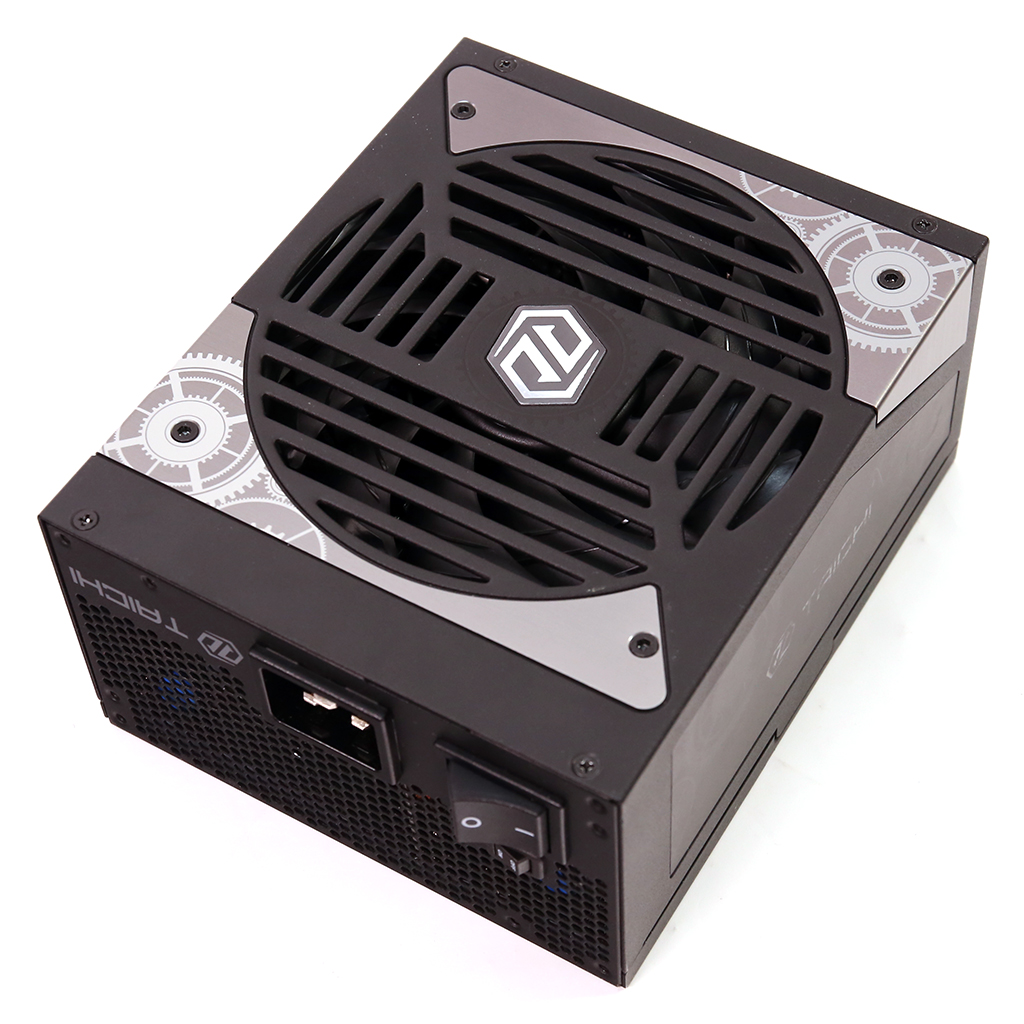
| Brand | ASRock |
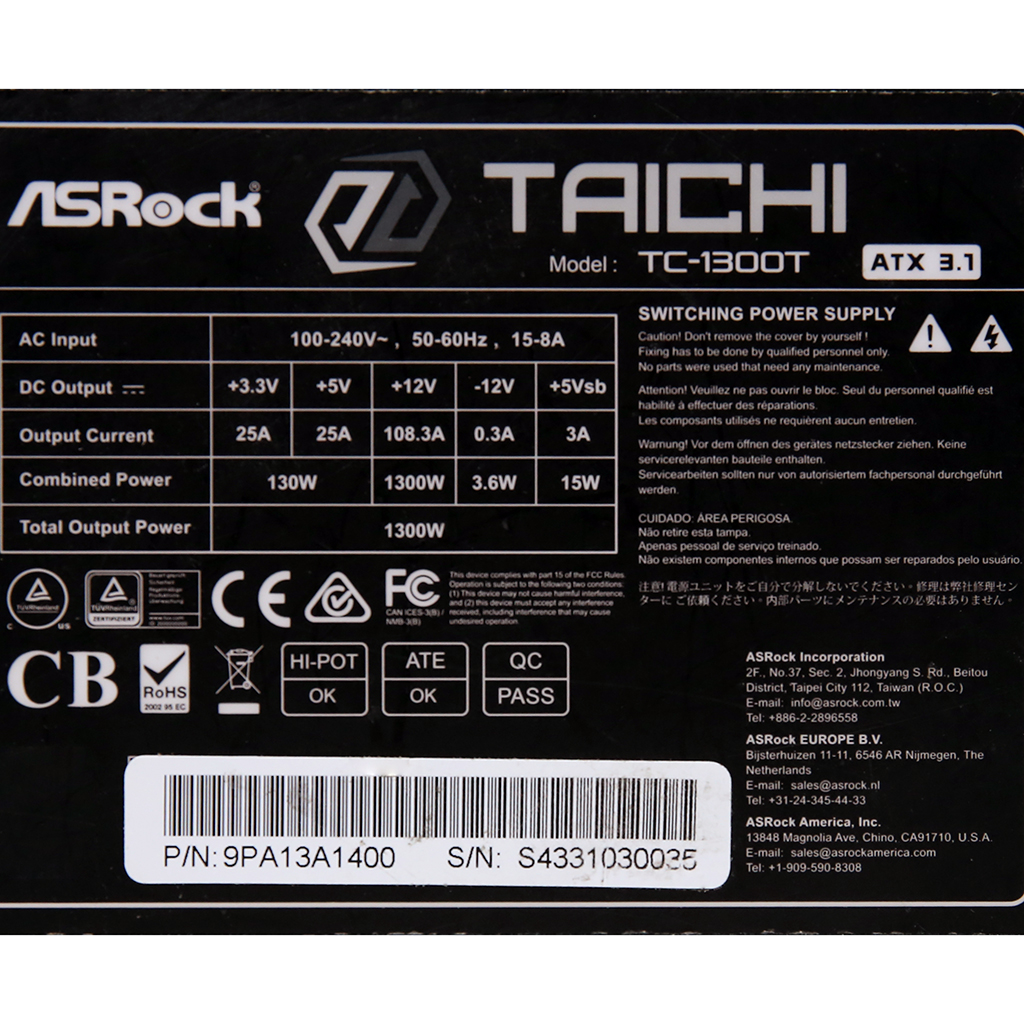
| Model | Taichi TC-1300T (ATXv3.1) |
| OEM | FSP |
| Serial Number | S4331030035 |
| Product Specifications | |
| Manufacturer | |
| 额定电压 (Vrms) | 100-240 |
| 额定电流 (Arms) | 8-15 |
| 额定频率 (Hz) | 50-60 |
| 额定功率 (W) | 1300 |
| Operating Temperature (Continuous Full Load) (°C) | |
| 类别 | ATX12V |
| 线材设计 | Fully Modular |
| Warranty | |
| Cybenetics | |
| Dimensions (W x H x D) | |
| Weight | |
| 散热 | 135mm Hydro Dynamic Bearing Fan (PLA13525S12M) |
| 半被动运转 | ✓ (selectable) |
| Cybenetics Testing Information | |
| Lab ID | AR13002623 |
| Date of receipt | Oct 14, 2024 |
| Testing Date | Oct 25, 2024 |
| Report Issued Date | Oct 29, 2024 |
| Engineer Name | - |
| Authorized By the Laboratory Technical Manager | Aristeidis Bitziopoulos |
| Signature | |