Cables and Connectors(Non-accredited measurements)
Modular Cables
Description
Cable Count
Connector Count (Total)
Gauge
In Cable Capacitors
ATX connector 20+4 pin (600mm)
1
1
16-18AWG
No
4+4 pin EPS12V (700mm)
1
1
16AWG
No
4+4 pin EPS12V (700mm+150mm)
1
2
16-18AWG
No
6+2 pin PCIe (700mm)
2
2
16AWG
No
6+2 pin PCIe (700mm+150mm)
2
4
16-18AWG
No
12+4 pin PCIe (600mm) (600W)
1
1
16-24AWG
No
SATA (550mm+150mm+150mm)
4
12
18AWG
No
4-pin Molex (550mm+150mm+150mm+150mm)
1
4
18AWG
No
AC Power Cord (1360mm) - C13 coupler
1
1
16AWG
-
Test Results
Temperature & Compliance Info
Temperature Range (°C /°F)
30-32 / 86-89.6
ErP Lot 3/6 Ready
✓
(EU) No 617/2013 Compliance
✓
ALPM (Alternative Low Power Mode) compatible
✓
ATX v3.1 PSU Power Excursion
✓
Performance Summary
效率評比
PLATINUM
噪音評比
Standard+
Average Efficiency (>1450 load combinations)
89.668%
Average Noise Output (>1450 Load Combinations)
36.37dBA
Average PF (>1450 Load Combinations)
0.994
Efficiency With 10W (≤500W) or 2% (>500W) Load
75.202%
Standby Power Consumption
0.0699W
12V Ripple (Full Load)
36.04mV
5V Ripple (Full Load)
21.67mV
3.3V Ripple (Full Load)
20.13mV
5VSB Ripple (Full Load)
27.11mV
12V Load Regulation
1.14%
5V Load Regulation
0.62%
3.3V Load Regulation
0.72%
5VSB Load Regulation
2.83%
Inrush Current
35.440A
效率評比
PLATINUM
噪音評比
Standard+
Average Efficiency (>1450 load combinations)
91.658%
Average Noise Output (>1450 Load Combinations)
36.14dBA
Average PF (>1450 Load Combinations)
0.972
Efficiency With 10W (≤500W) or 2% (>500W) Load
74.608%
Standby Power Consumption
0.1559W
12V Ripple (Full Load)
36.60mV
5V Ripple (Full Load)
21.48mV
3.3V Ripple (Full Load)
20.71mV
5VSB Ripple (Full Load)
26.08mV
12V Load Regulation
1.18%
5V Load Regulation
0.64%
3.3V Load Regulation
0.69%
5VSB Load Regulation
2.83%
Inrush Current
65.600A
12V Transient Response (200%)
11.12V
5V Transient Response (200%)
4.924V
3.3V Transient Response (200%)
3.139V
5VSB Transient Response (200%)
4.919V
Hold-Up Time & Power Ok Signal
29.60ms
AC Loss to PWR_OK Hold Up Time
22.50ms
PWR_OK Inactive to DC Loss Delay
7.10ms
PSU Timings: T1 (20% / 100%)
92.0ms
95.0ms
PSU Timings: T3 (20% / 100%)
126.0ms
126.0ms
12V OCP (30.2°C / 46.3°C)
152.80A (141.09%), 11.968V
152.40A (140.72%), 11.978V
5V OCP (30.2°C / 46.3°C)
31.2A (130.00%), 4.997V
31.2A (130.00%), 4.994V
3.3V OCP (30.2°C / 46.3°C)
30.7A (127.92%), 3.319V
30.6A (127.50%), 3.321V
5VSB OCP (30.2°C / 46.3°C)
5.6A (186.67%), 4.957V
5.6A (186.67%), 4.955V
OPP (29.68°C / 44.02°C)
137.17%
126.78%
Hold-Up Time & Power Ok Signal
Hold-Up Time (ms)
29.6
AC Loss to PWR_OK Hold Up Time (ms)
22.5
PWR_OK Inactive to DC Loss Delay (ms)
7.1
待機電源消耗
Tables
Detailed Results
Average
Min
Limit Min
Max
Limit Max
Result
Mains Voltage RMS:
115.03 V
115.01 V
113.85 V
115.10 V
116.15 V
PASS
Mains Frequency:
60.00 Hz
59.95 Hz
59.40 Hz
60.02 Hz
60.60 Hz
PASS
Mains Voltage CF:
1.416
1.415
1.340
1.418
1.490
PASS
Mains Voltage THD:
0.13 %
0.09 %
N/A
0.18 %
2.00 %
PASS
Real Power:
0.070 W
-0.003 W
N/A
0.127 W
N/A
N/A
Apparent Power:
11.077 W
10.527 W
N/A
11.656 W
N/A
N/A
Power Factor:
0.008
N/A
N/A
N/A
N/A
N/A
Detailed Results
Average
Min
Limit Min
Max
Limit Max
Result
Mains Voltage RMS:
231.01 V
230.90 V
227.70 V
231.08 V
232.30 V
PASS
Mains Frequency:
50.00 Hz
49.99 Hz
49.50 Hz
50.01 Hz
50.50 Hz
PASS
Mains Voltage CF:
1.417
1.416
1.340
1.419
1.490
PASS
Mains Voltage THD:
0.17 %
0.14 %
N/A
0.27 %
2.00 %
PASS
Real Power:
0.156 W
0.088 W
N/A
0.311 W
N/A
N/A
Apparent Power:
36.355 W
35.288 W
N/A
37.509 W
N/A
N/A
Power Factor:
0.004
N/A
N/A
N/A
N/A
N/A
Graphs
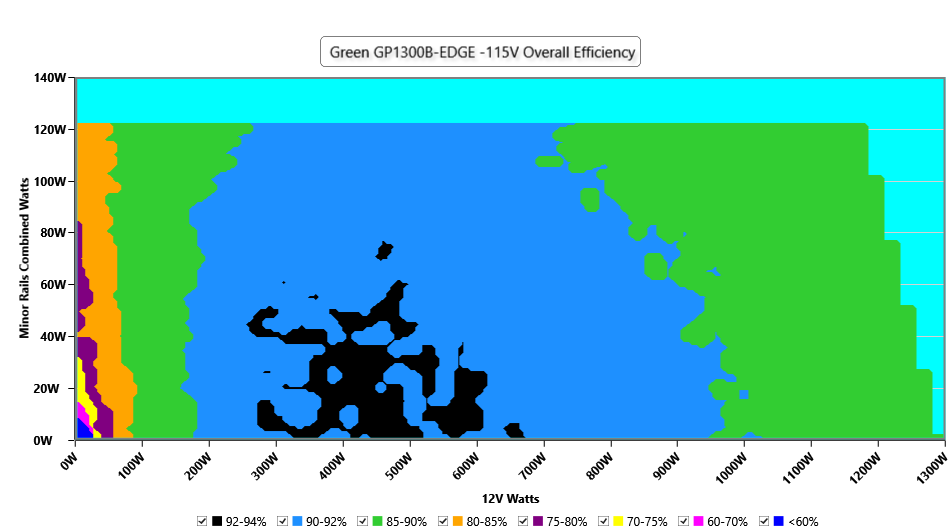
Efficiency Graph
INFO
This graph depicts the PSU`s efficiency throughout its entire operational range. For the generation of the efficiency and noise graphs we set our loaders to auto mode through our custom-made software before trying thousands of possible load combinations
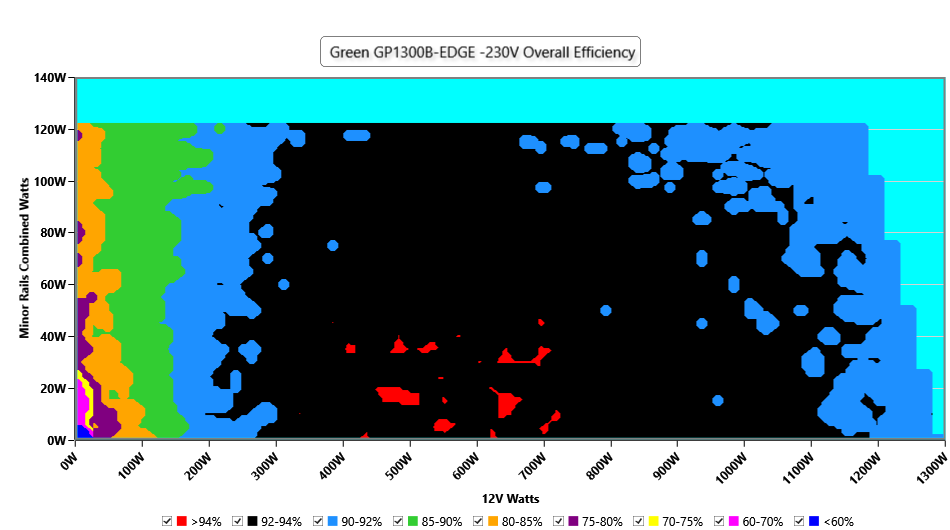
INFO
This graph depicts the PSU`s efficiency throughout its entire operational range. For the generation of the efficiency and noise graphs we set our loaders to auto mode through our custom-made software before trying thousands of possible load combinations
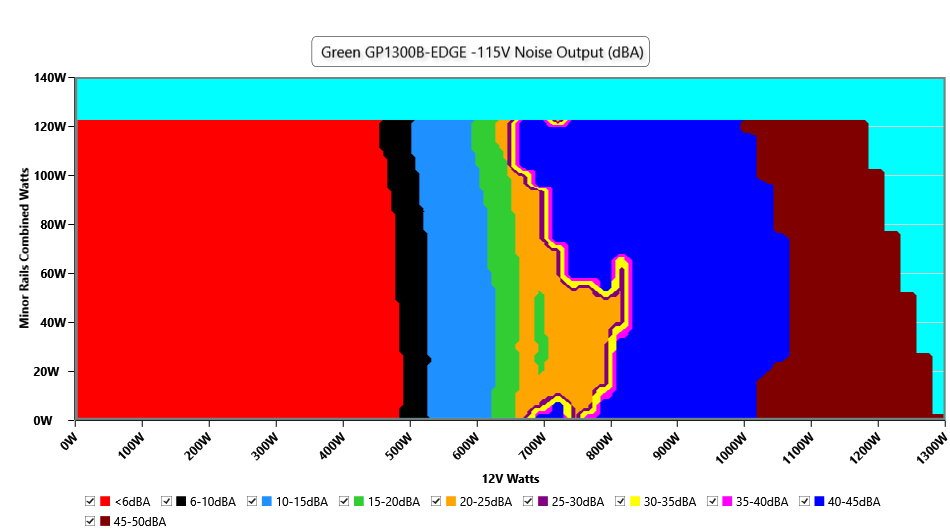
Noise Graph
INFO
The PSU`s noise in its entire operational range and under 30-32 °C ambient is depicted in this graph. The X axis represents the load on the +12V rail(s) while the Y axis is the load on the minor rails
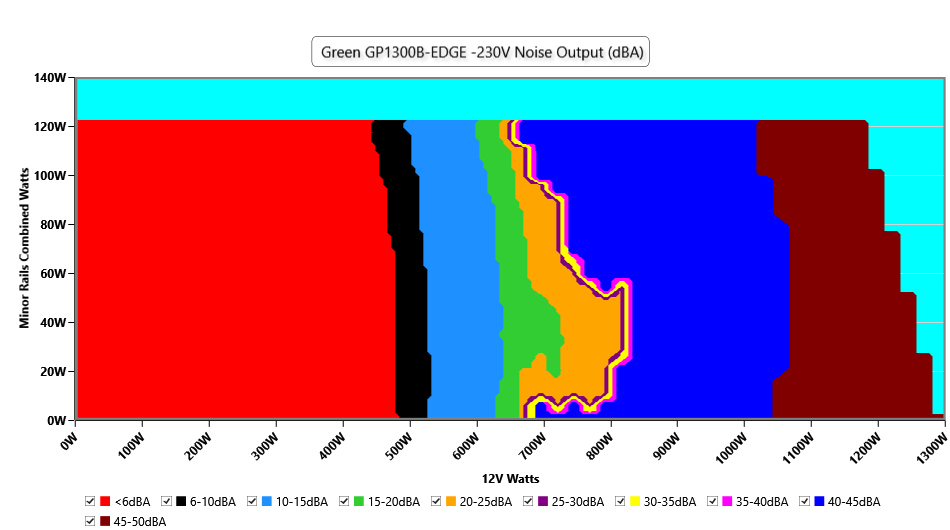
INFO
The PSU`s noise in its entire operational range and under 30-32 °C ambient is depicted in this graph. The X axis represents the load on the +12V rail(s) while the Y axis is the load on the minor rails
Conducted Emissions EN55032 & CISPR 32
Indicative Performance
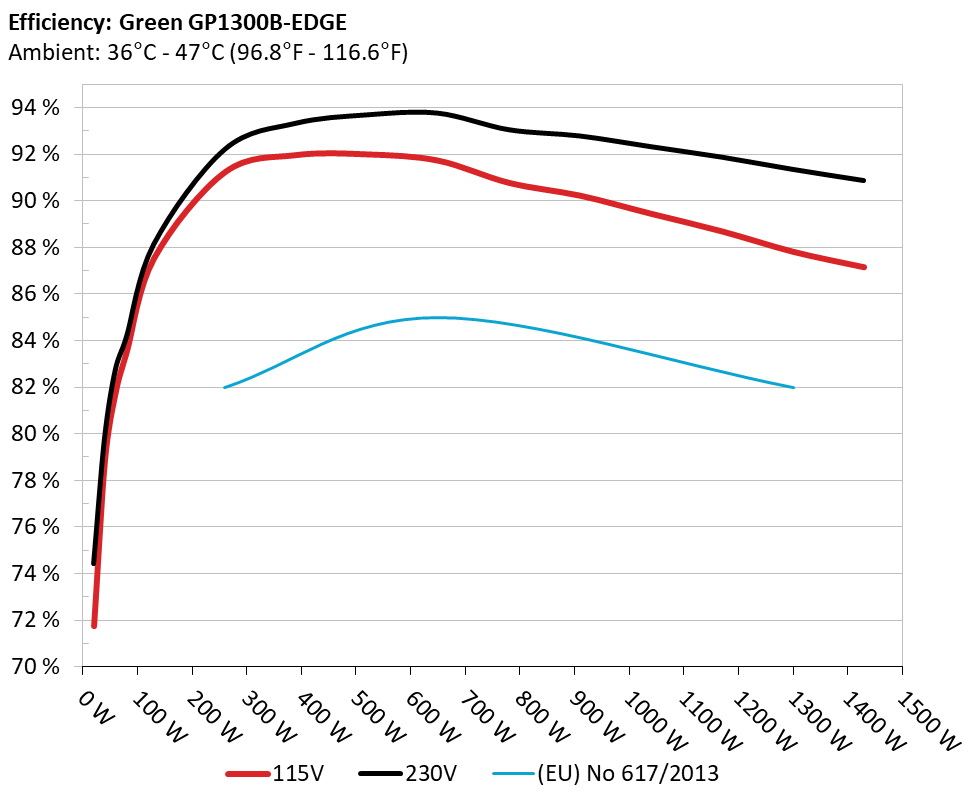
Efficiency under high ambient temperature
INFO
The PSU`s efficiency under high ambient temperatures with 115V and 230V input. For this graph the results of the 10-110% load regulation table are used
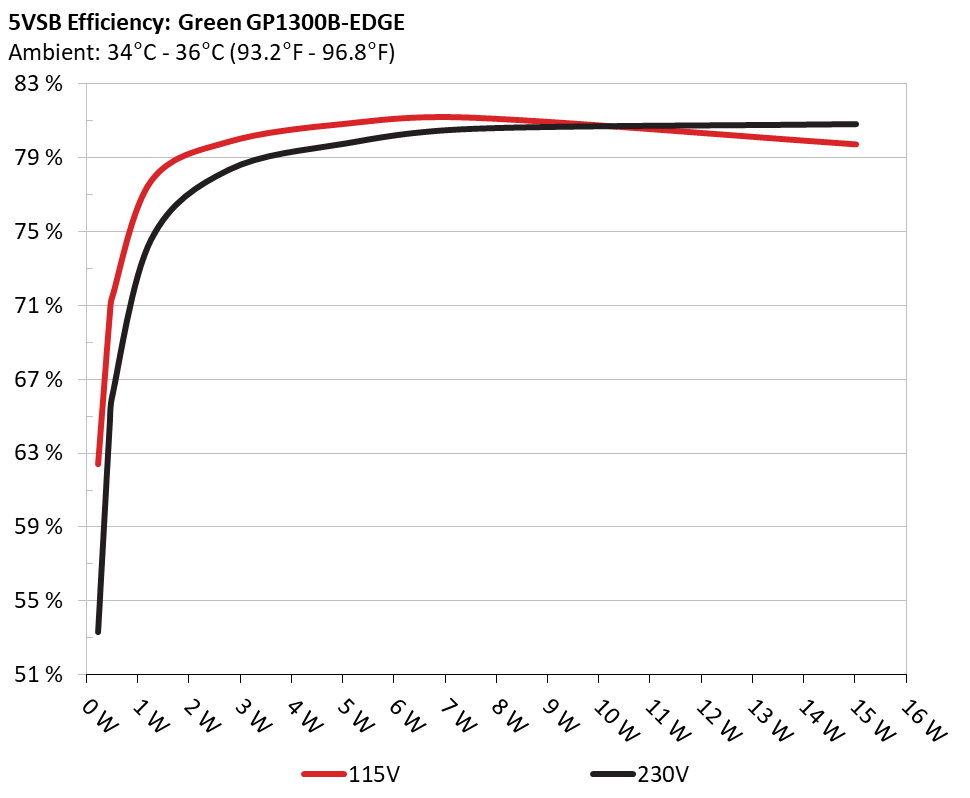
5VSB Efficiency
INFO
This graph depicts the efficiency levels of the 5VSB rail with 115V and 230V input


 Outside Validation Scope