| 115V | 230V | |
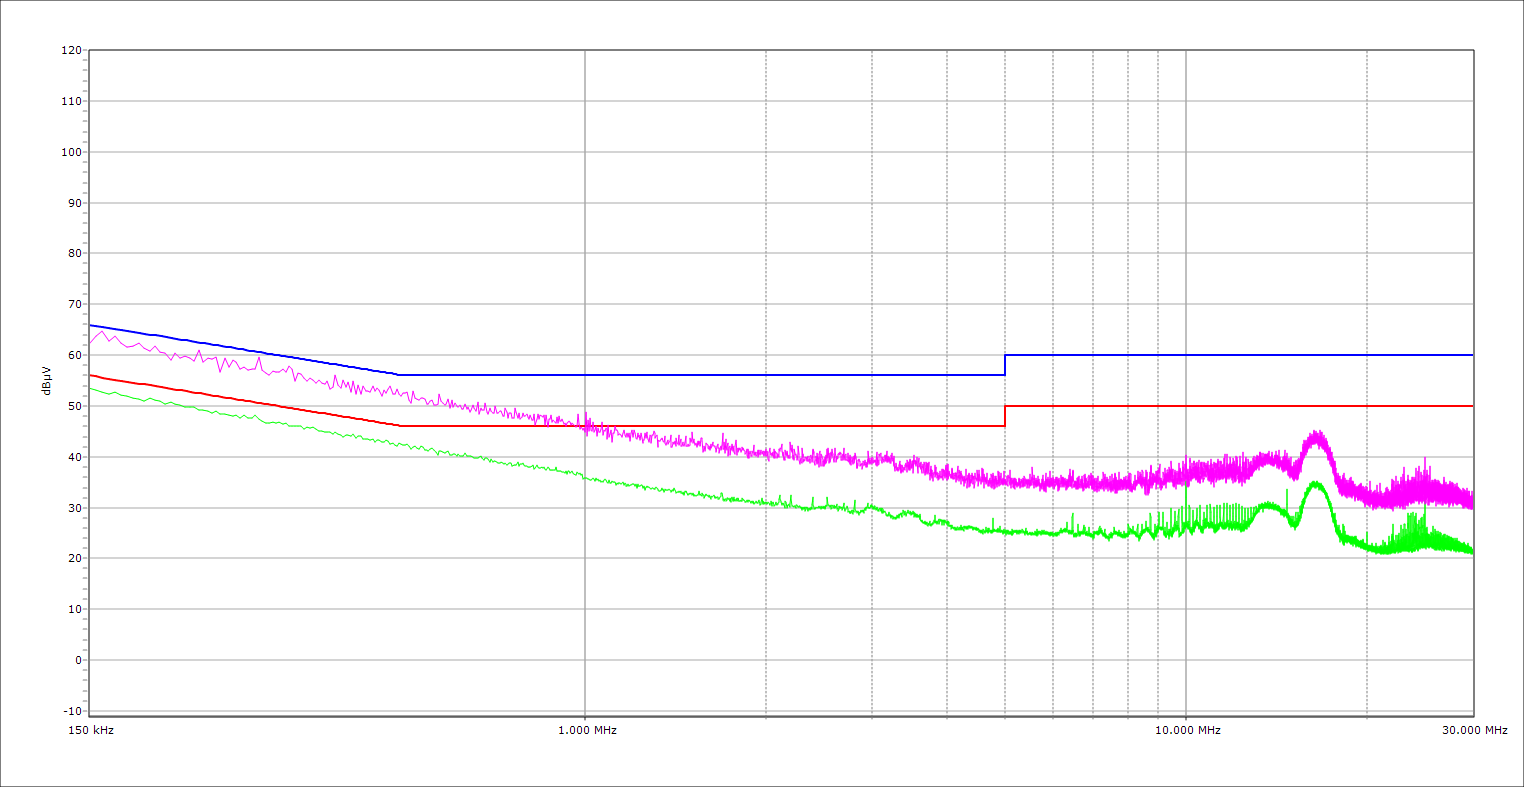
| Scheme: ETA-EMI PSU |  |
| 115V | 230V | |
 |
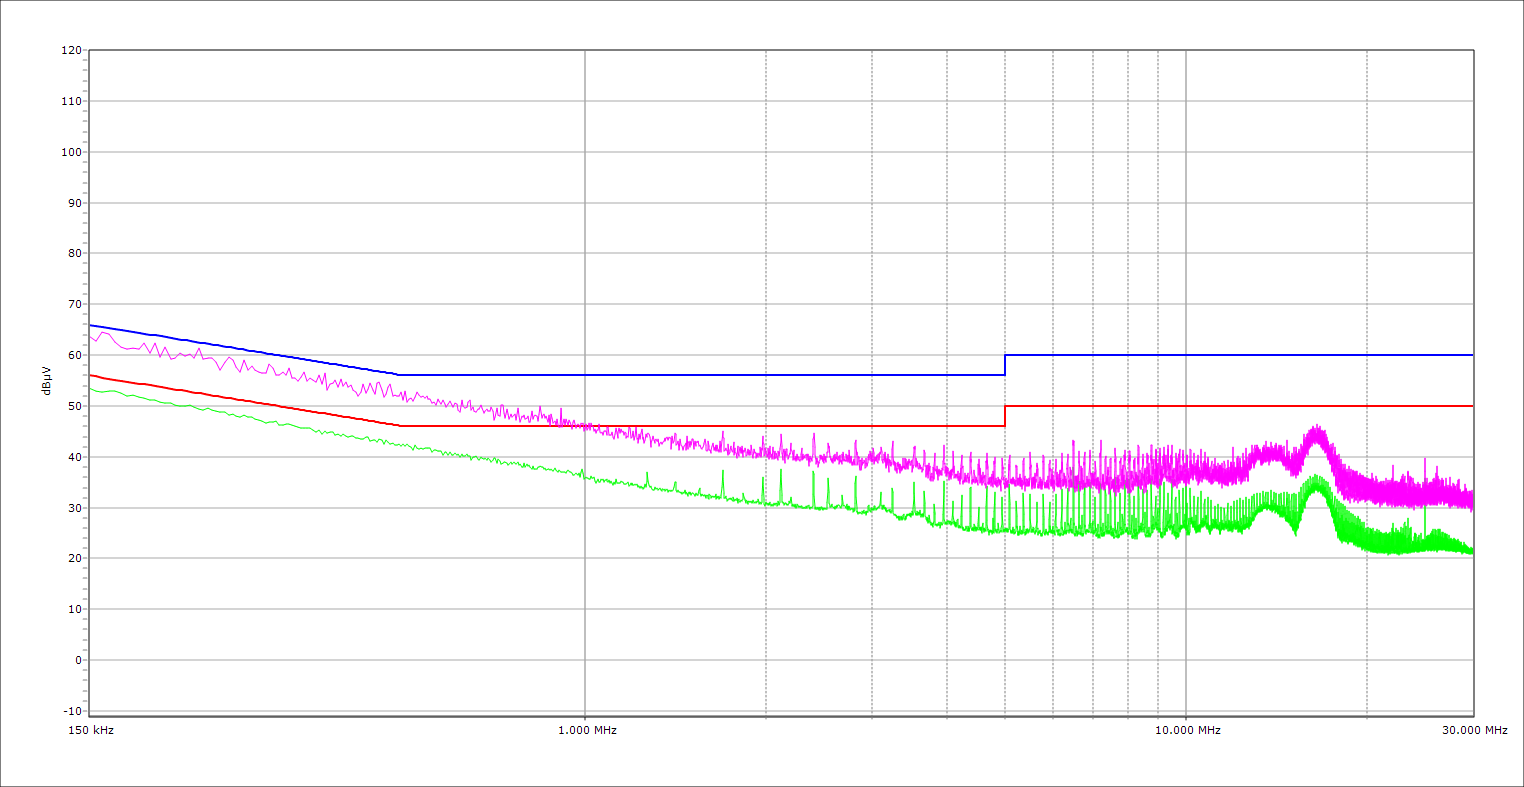
Scheme: LAMBDA PSU |

| Product Identification Details | |
| Brand | PC Componentes |
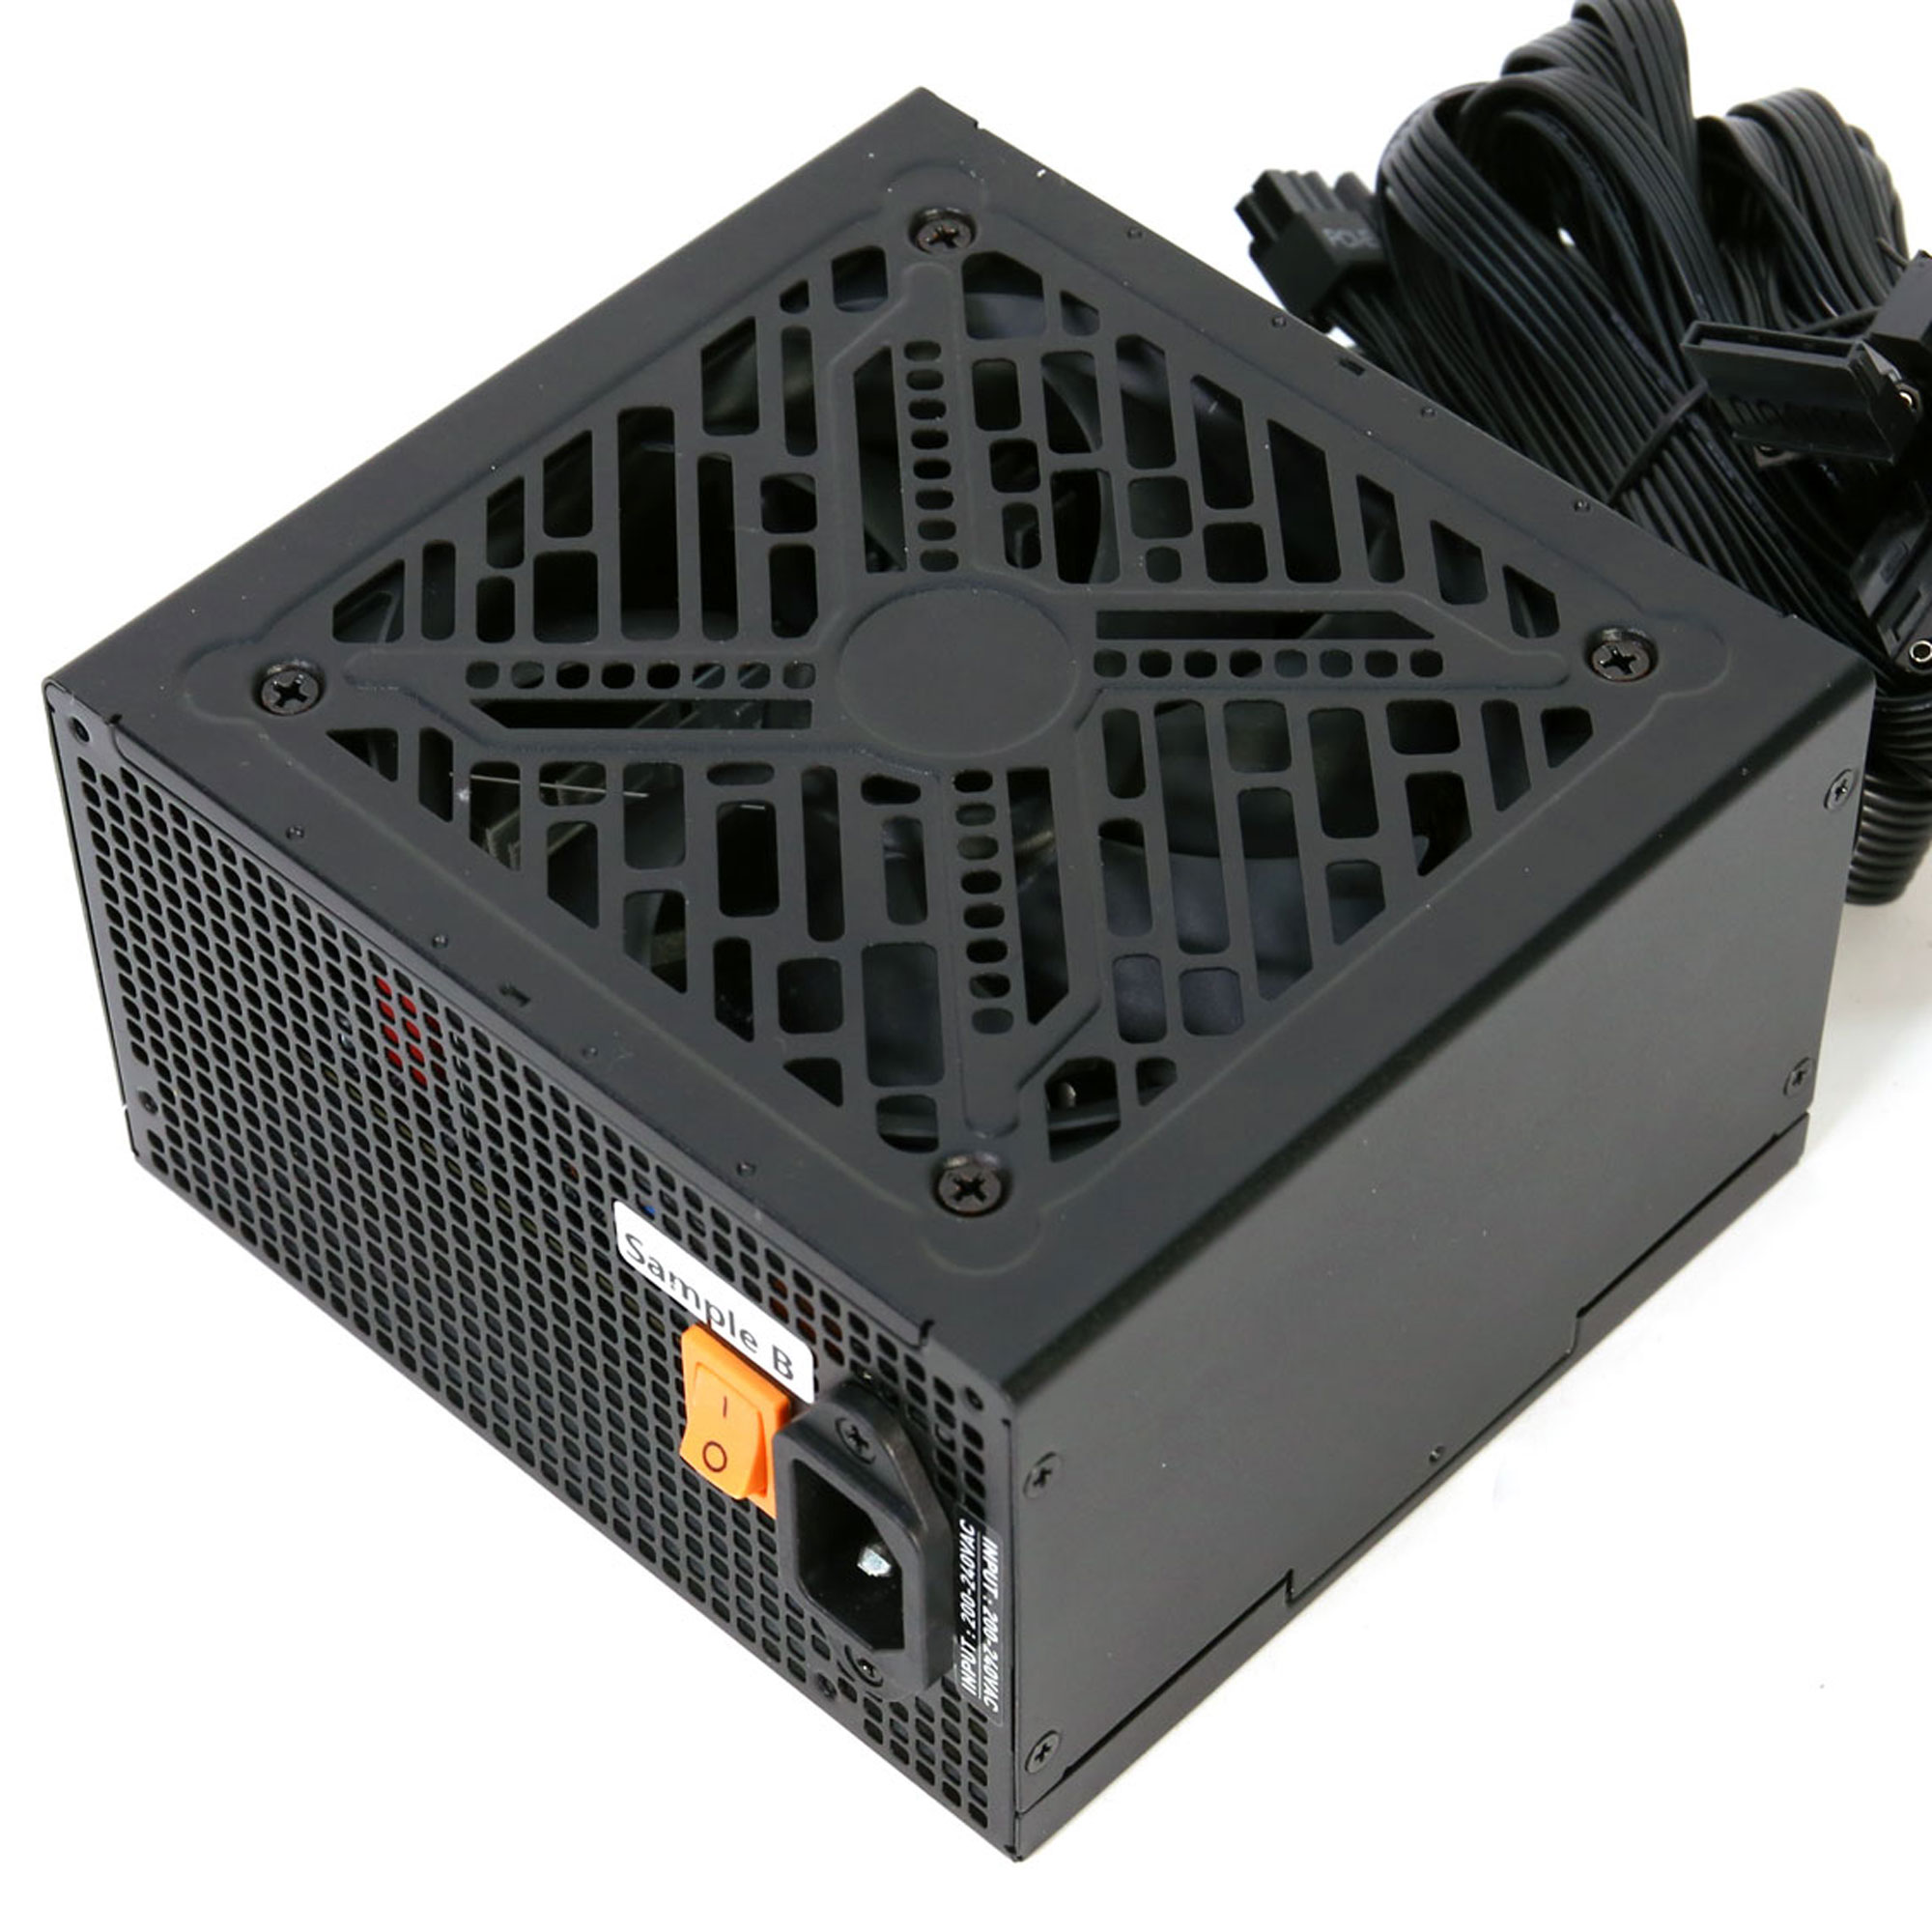
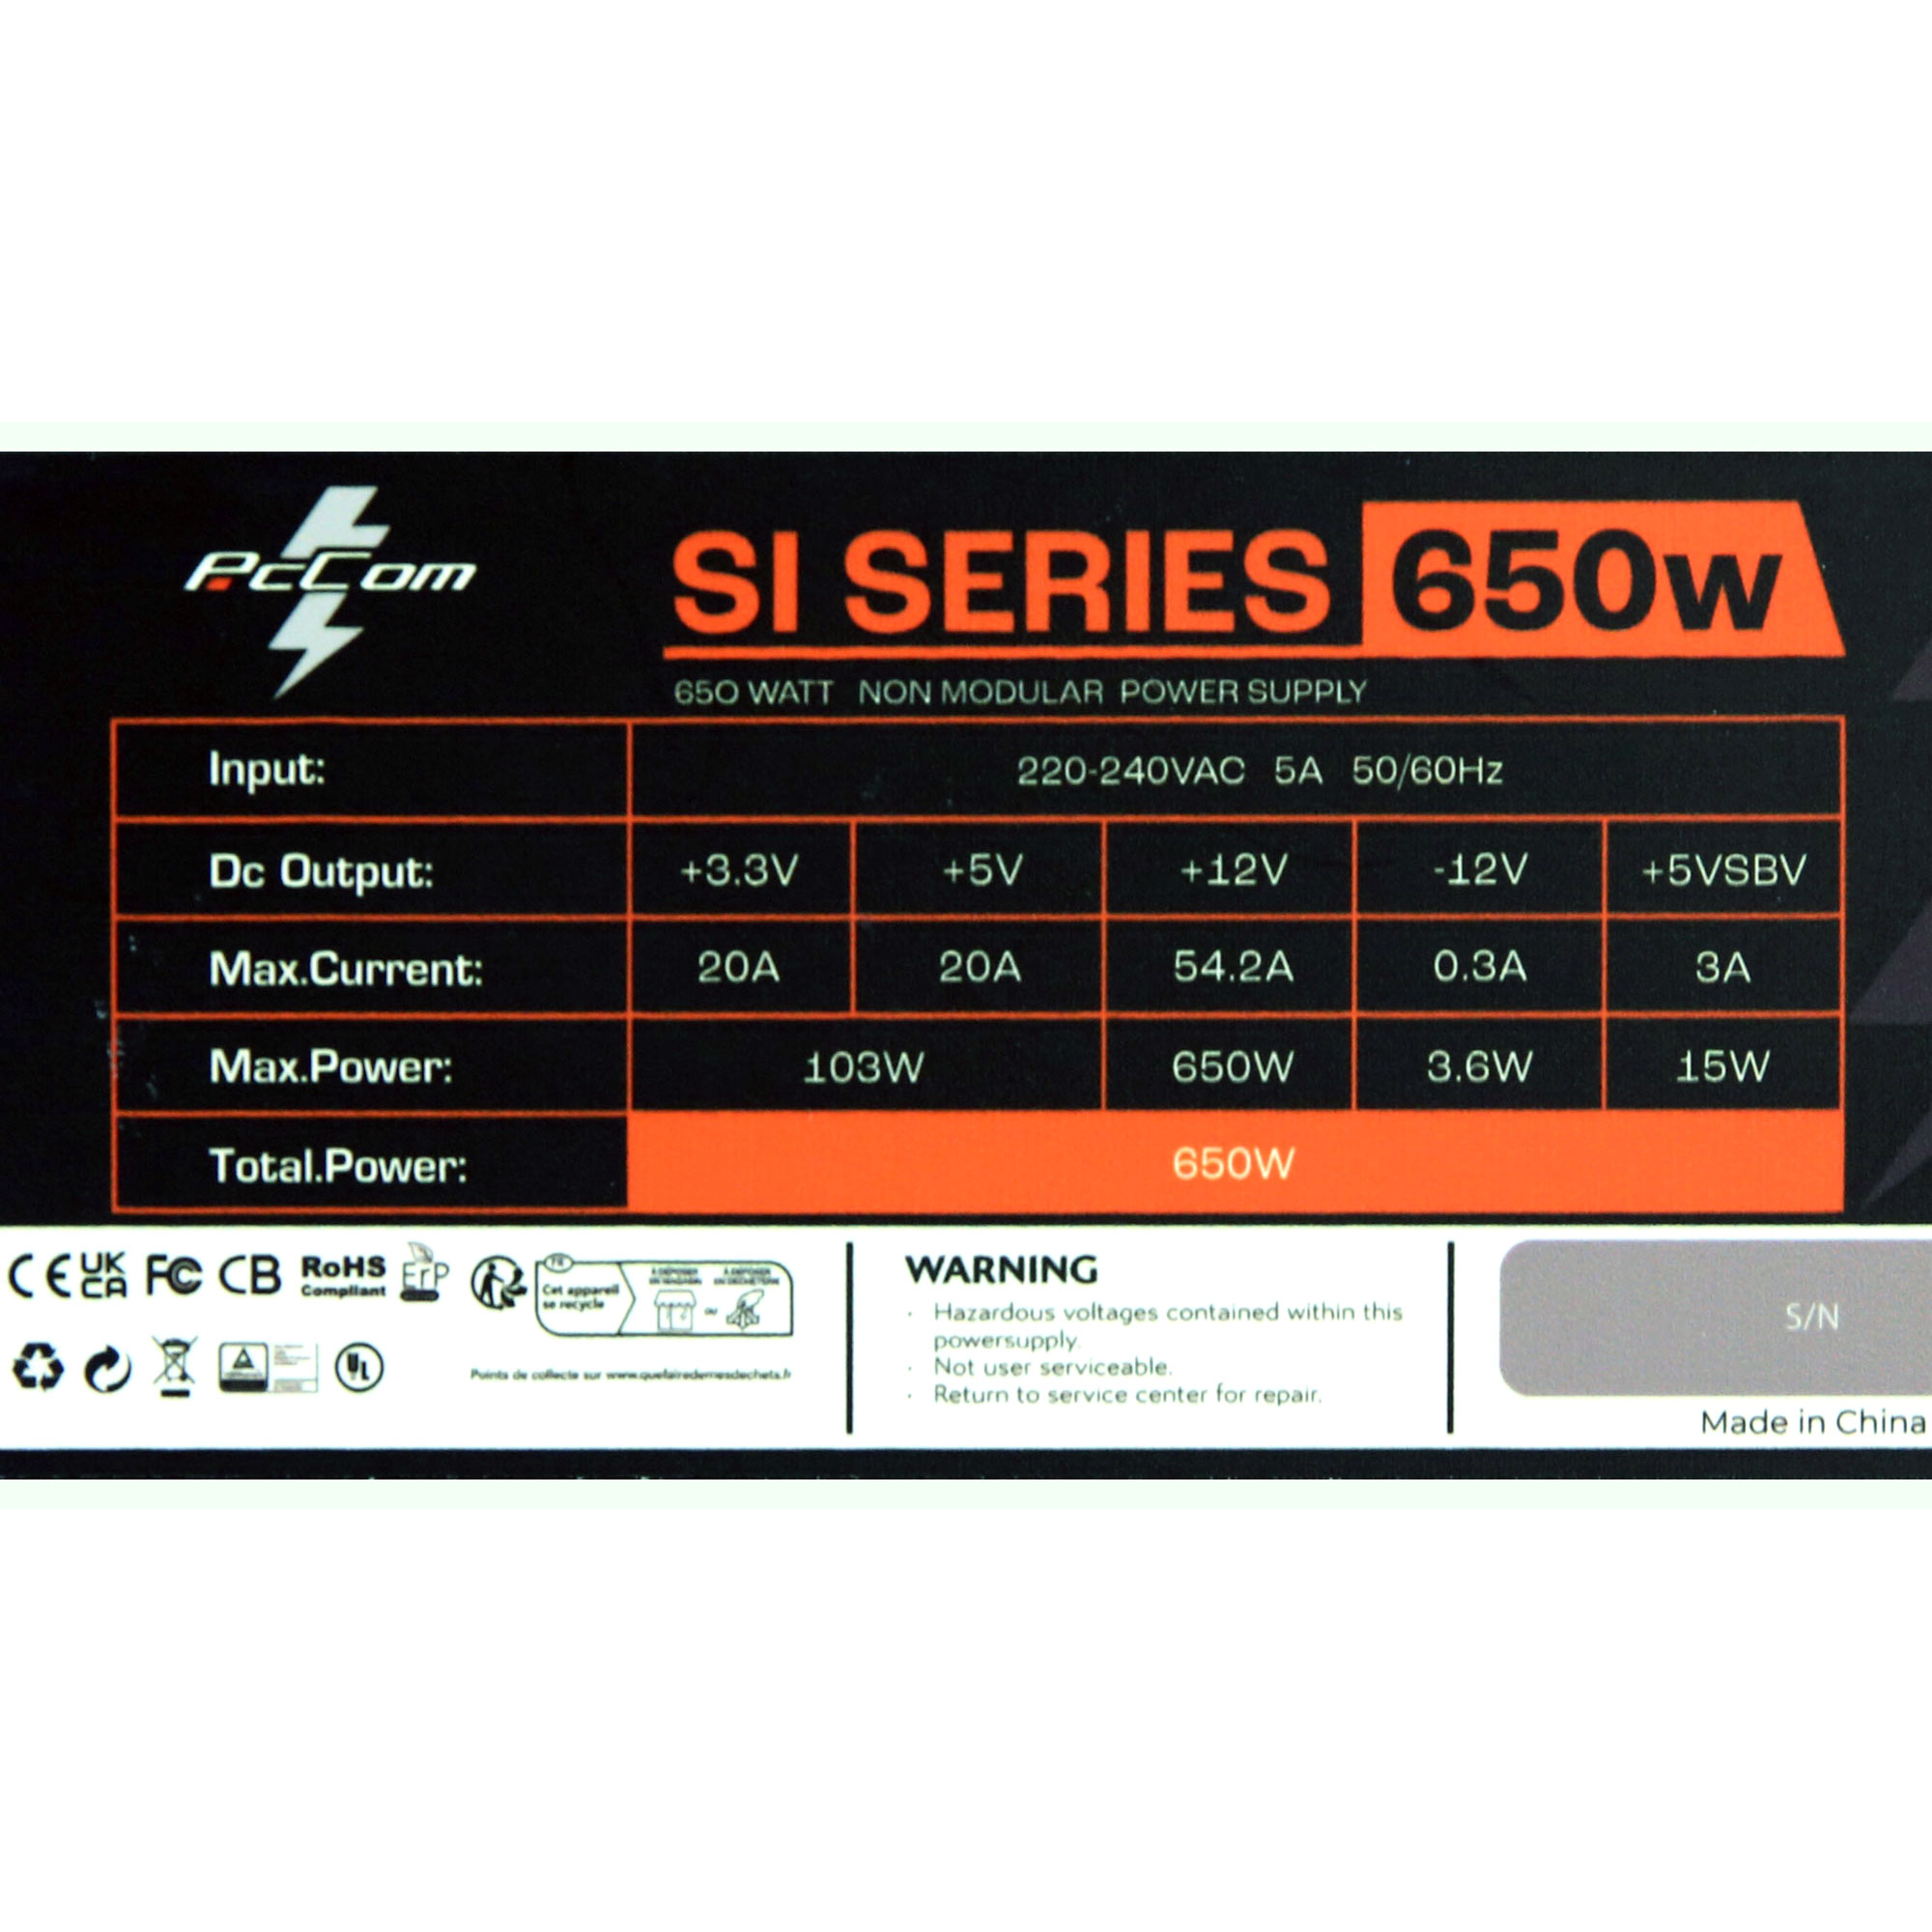
| Model | SI Series 650W |
| OEM | Kinpower |
| Serial Number | - |
| Product Specifications | |
| Manufacturer | |
| Rated Voltage (Vrms) | 220-240 |
| Rated Current (Arms) | 5 |
| Rated Frequency (Hz) | 50-60 |
| Rated Power (W) | 650 |
| Operating Temperature (Continuous Full Load) (°C) | |
| Type | ATX12V |
| Cable Design | Fixed cables |
| Warranty | |
| Cybenetics | |
| Dimensions (W x H x D) | |
| Weight | |
| Cooling | 120mm Fluid Dynamic Bearing Fan (HA1225M12F-Z) |
| Semi-Passive Operation | ✗ |
| Cybenetics Testing Information | |
| Lab ID | PO65002857 |
| Date of receipt | May 18, 2025 |
| Testing Date | Jun 20, 2025 |
| Report Issued Date | Jun 20, 2025 |
| DUT Notes | The +12V rail OCP needs adjustment. |
| Engineer Name | - |
| Authorized By the Laboratory Technical Manager | Aristeidis Bitziopoulos |
| Signature | |