3.4A (113.33%), 4.877V *High Ripple (63.79mV), Voltage Drop (4.735V @ 3.6A)
OPP (27.72°C / 43.21°C)
142.67%
139.97%
Hold-Up Time & PWR_OK Signal
Hold-Up Time (ms)
17.5
AC Loss to PWR_OK Hold Up Time (ms)
15.5
PWR_OK Inactive to DC Loss Delay (ms)
2
待機電源消耗
Tables
Detailed Results
Average
Min
Limit Min
Max
Limit Max
Result
Mains Voltage RMS:
115.05 V
115.03 V
113.85 V
115.09 V
116.15 V
PASS
Mains Frequency:
60.00 Hz
59.95 Hz
59.40 Hz
60.01 Hz
60.60 Hz
PASS
Mains Voltage CF:
1.416
1.415
1.340
1.416
1.490
PASS
Mains Voltage THD:
0.13 %
0.10 %
N/A
0.16 %
2.00 %
PASS
Real Power:
0.053 W
0.007 W
N/A
0.092 W
N/A
N/A
Apparent Power:
9.978 W
9.957 W
N/A
9.998 W
N/A
N/A
Power Factor:
0.006
N/A
N/A
N/A
N/A
N/A
Detailed Results
Average
Min
Limit Min
Max
Limit Max
Result
Mains Voltage RMS:
230.10 V
230.06 V
227.70 V
230.12 V
232.30 V
PASS
Mains Frequency:
50.00 Hz
50.00 Hz
49.50 Hz
50.00 Hz
50.50 Hz
PASS
Mains Voltage CF:
1.415
1.415
1.340
1.416
1.490
PASS
Mains Voltage THD:
0.14 %
0.13 %
N/A
0.16 %
2.00 %
PASS
Real Power:
0.127 W
0.090 W
N/A
0.188 W
N/A
N/A
Apparent Power:
32.632 W
32.602 W
N/A
32.663 W
N/A
N/A
Power Factor:
0.004
N/A
N/A
N/A
N/A
N/A
Graphs
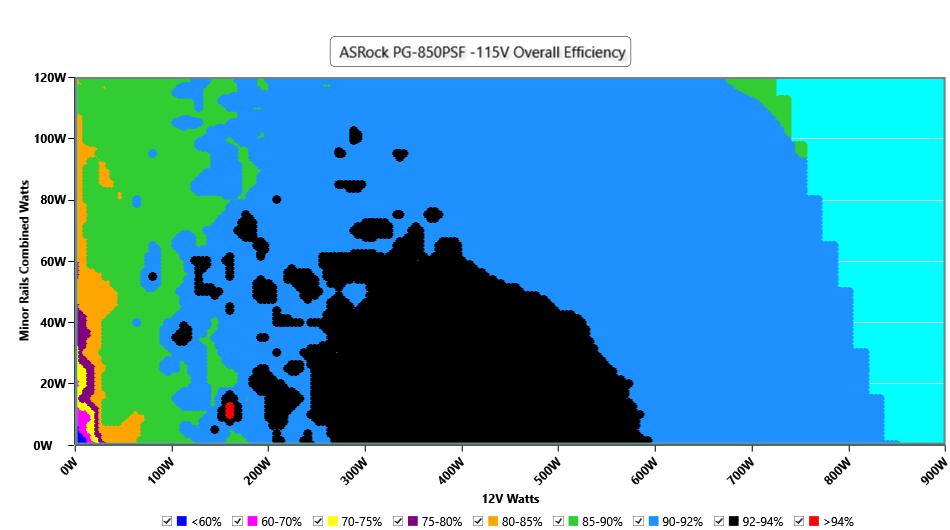
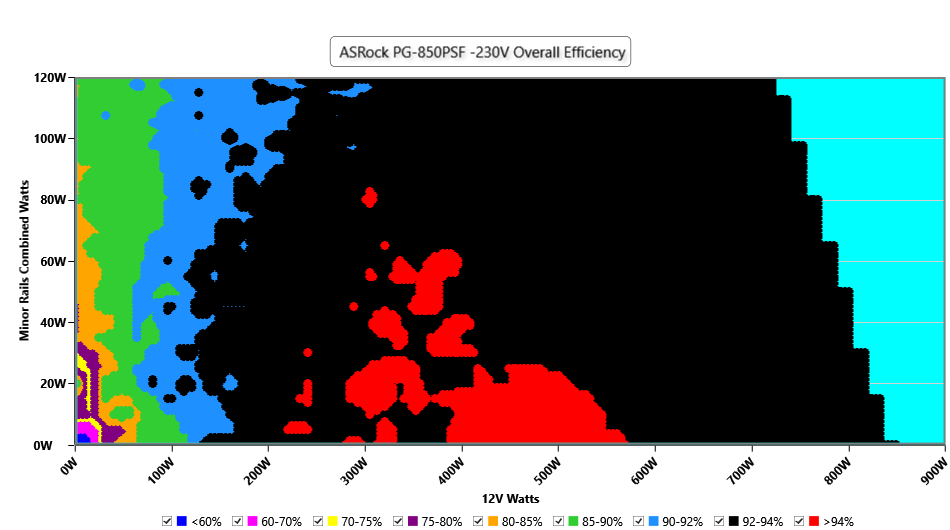
Efficiency Graph
INFO
This graph depicts the PSU`s efficiency throughout its entire operational range. For the generation of the efficiency and noise graphs we set our loaders to auto mode through our custom-made software before trying thousands of possible load combinations
INFO
This graph depicts the PSU`s efficiency throughout its entire operational range. For the generation of the efficiency and noise graphs we set our loaders to auto mode through our custom-made software before trying thousands of possible load combinations
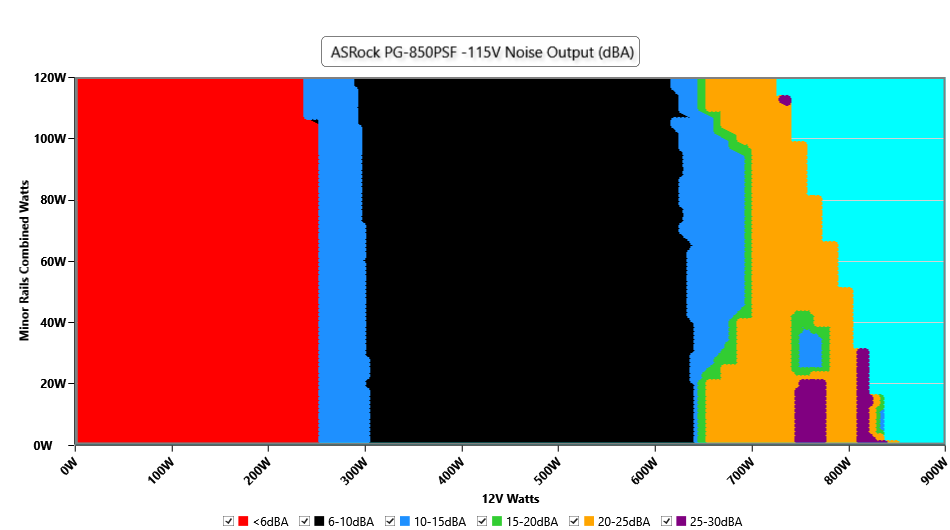
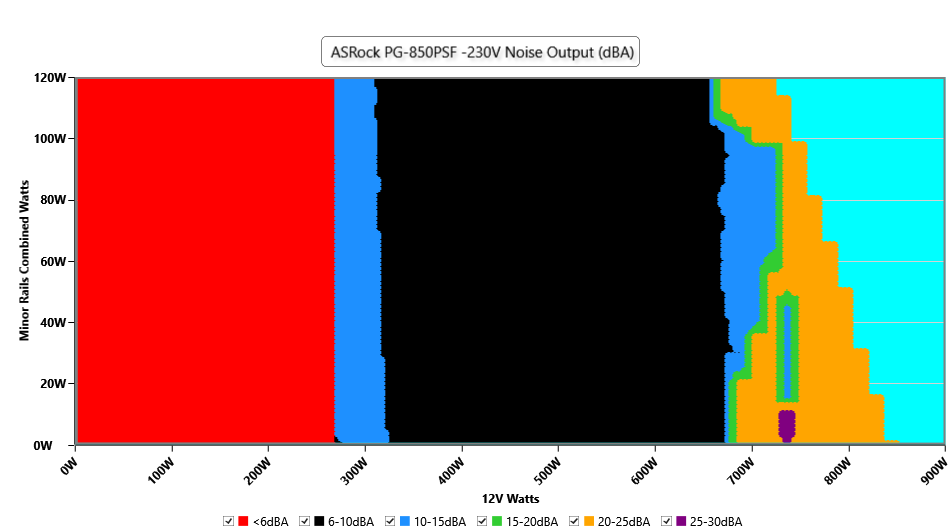
Noise Graph
INFO
The PSU`s noise in its entire operational range and under 30-32 °C ambient is depicted in this graph. The X axis represents the load on the +12V rail(s) while the Y axis is the load on the minor rails
INFO
The PSU`s noise in its entire operational range and under 30-32 °C ambient is depicted in this graph. The X axis represents the load on the +12V rail(s) while the Y axis is the load on the minor rails
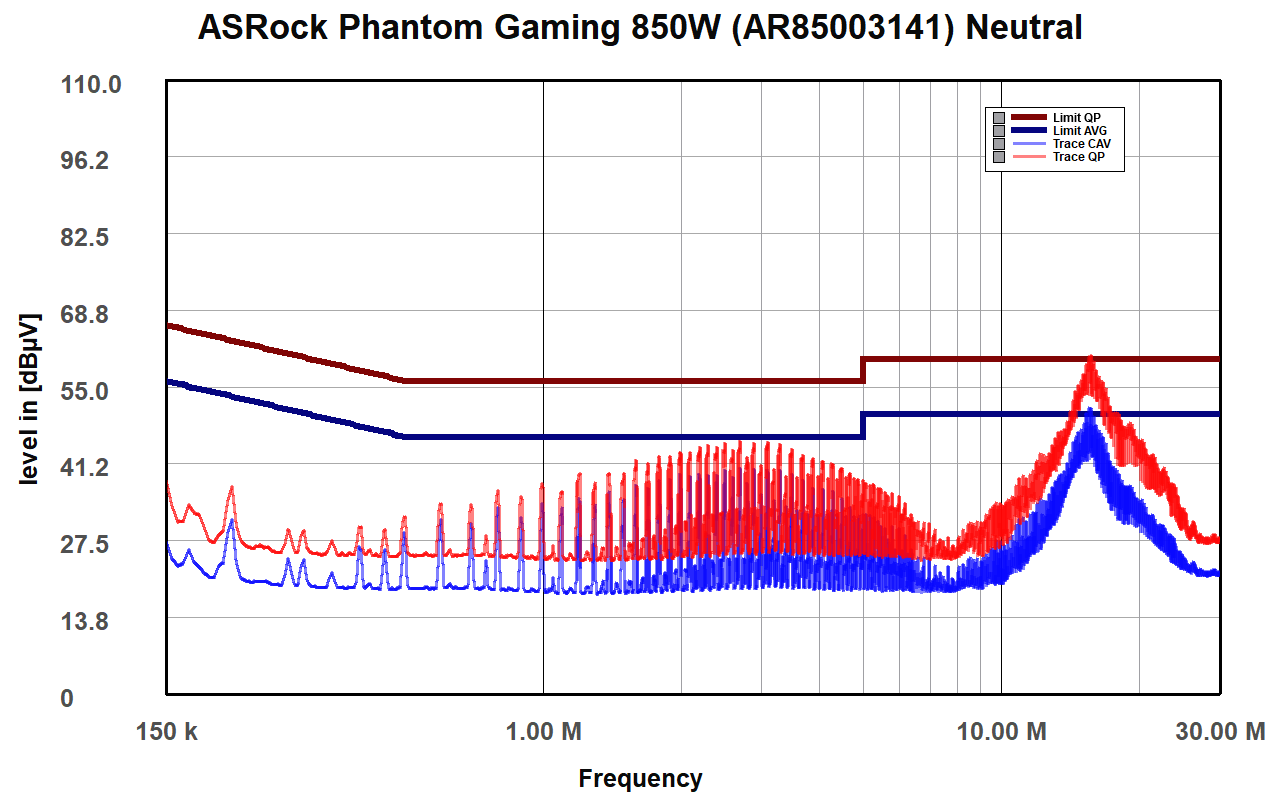
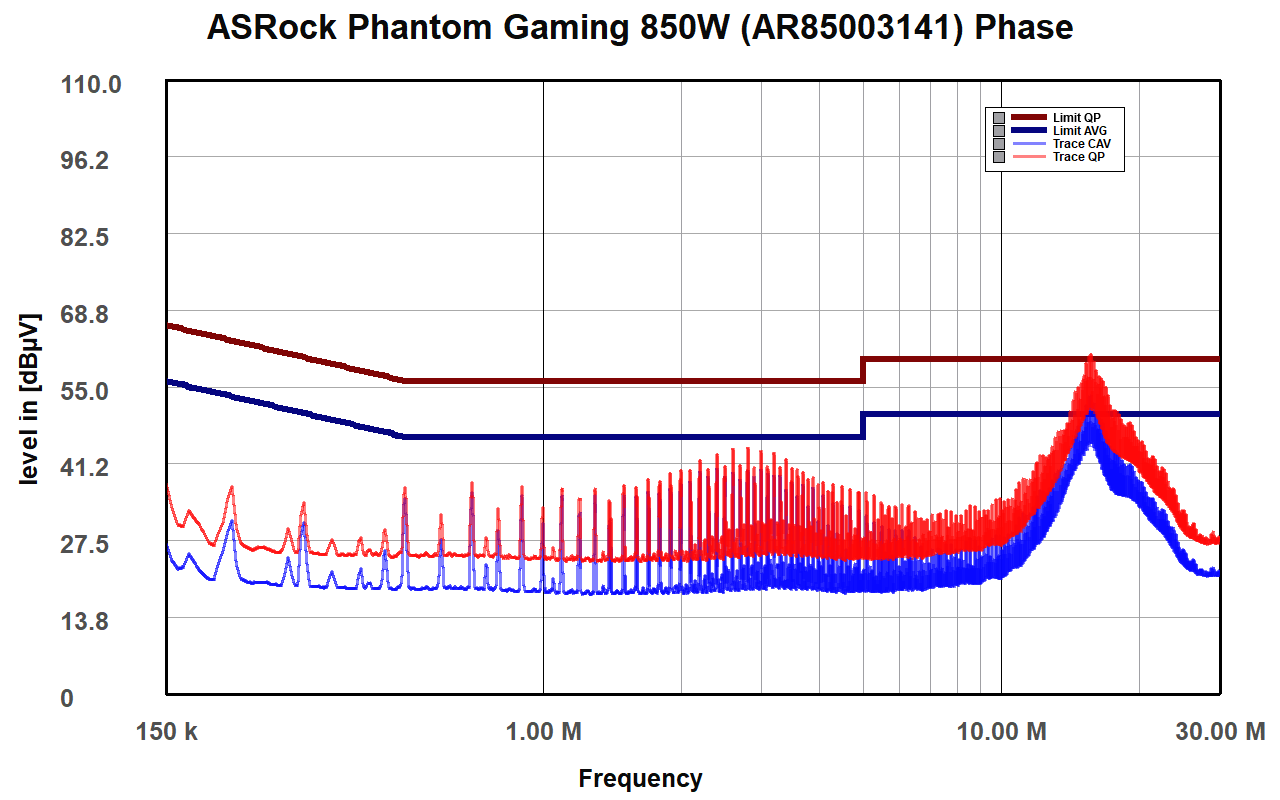
Conducted Emissions EN 55032 & CISPR 32
NEUTRAL
PHASE
Indicative Performance
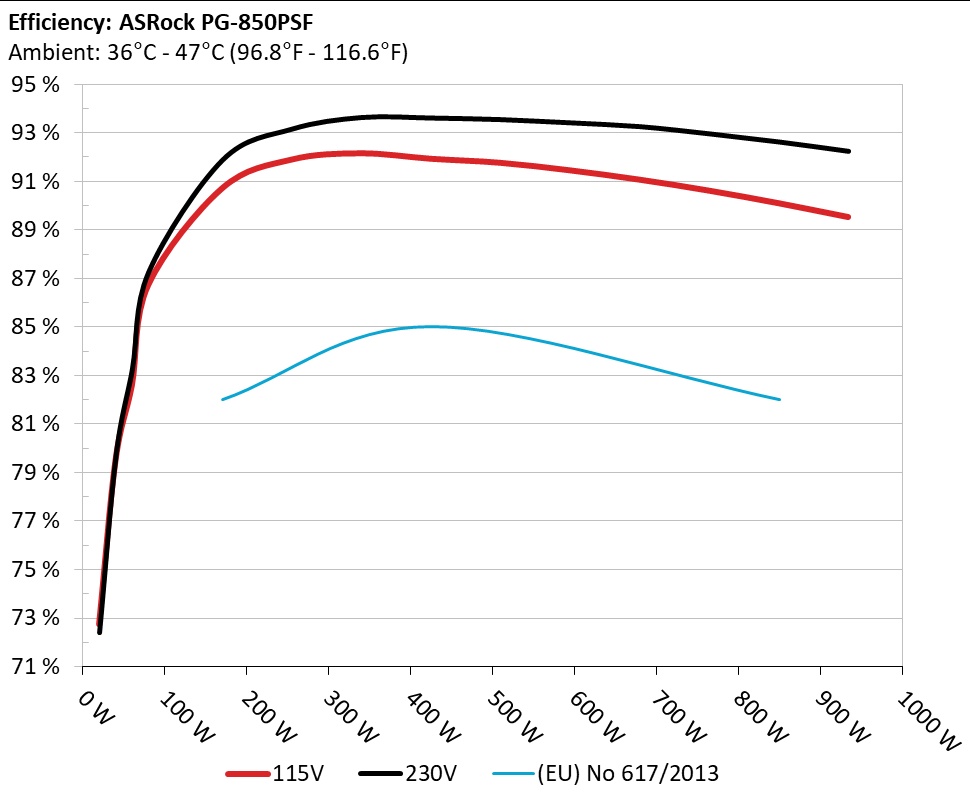
Efficiency under high ambient temperature
INFO
The PSU`s efficiency under high ambient temperatures with 115V and 230V input. For this graph the results of the 10-110% load regulation table are used
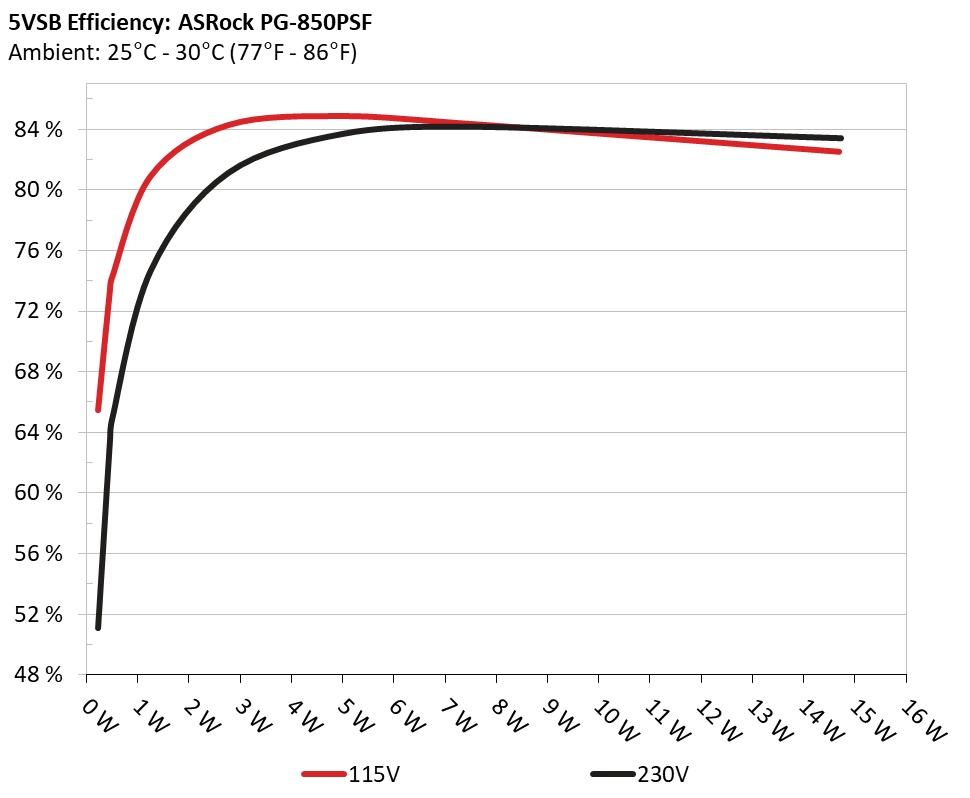
5VSB Efficiency
INFO
This graph depicts the efficiency levels of the 5VSB rail with 115V and 230V input