| 115V | 230V | |
| Scheme: ETA-EMI PSU |  |
 |
| 115V | 230V | |
 |
 |
Scheme: LAMBDA PSU |

| Product Identification Details | |
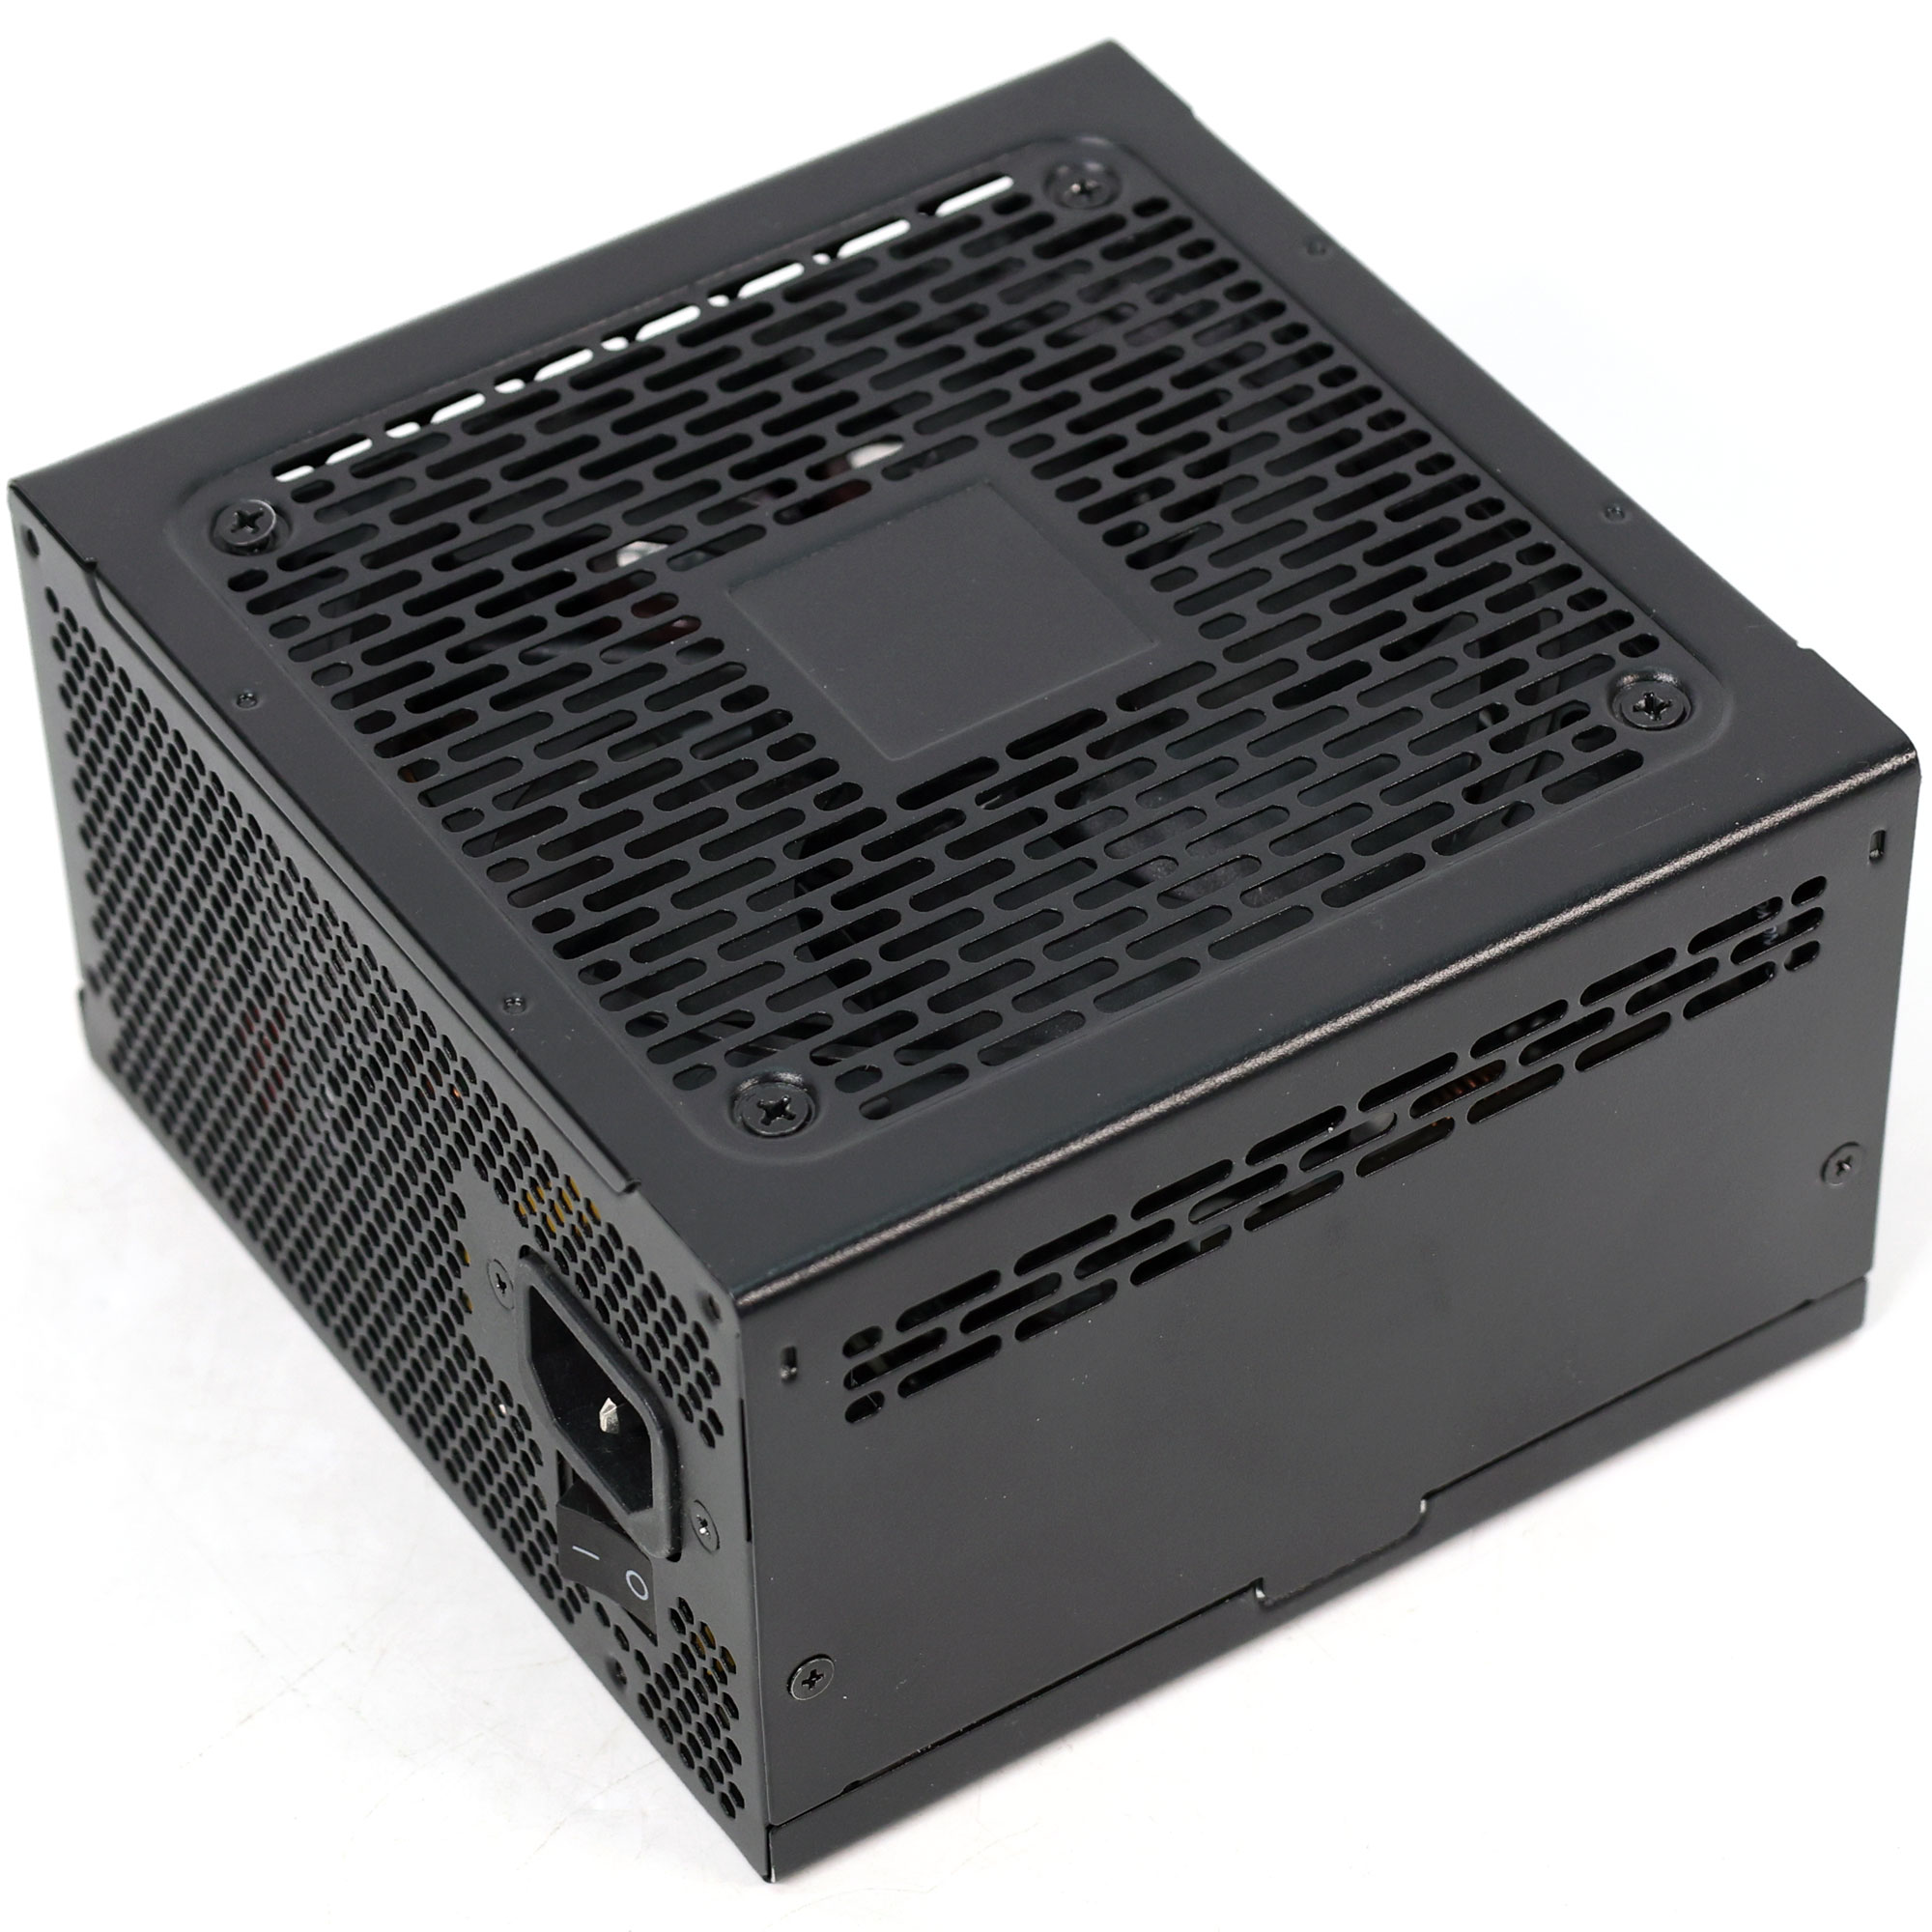
| Brand | Iron Pride |
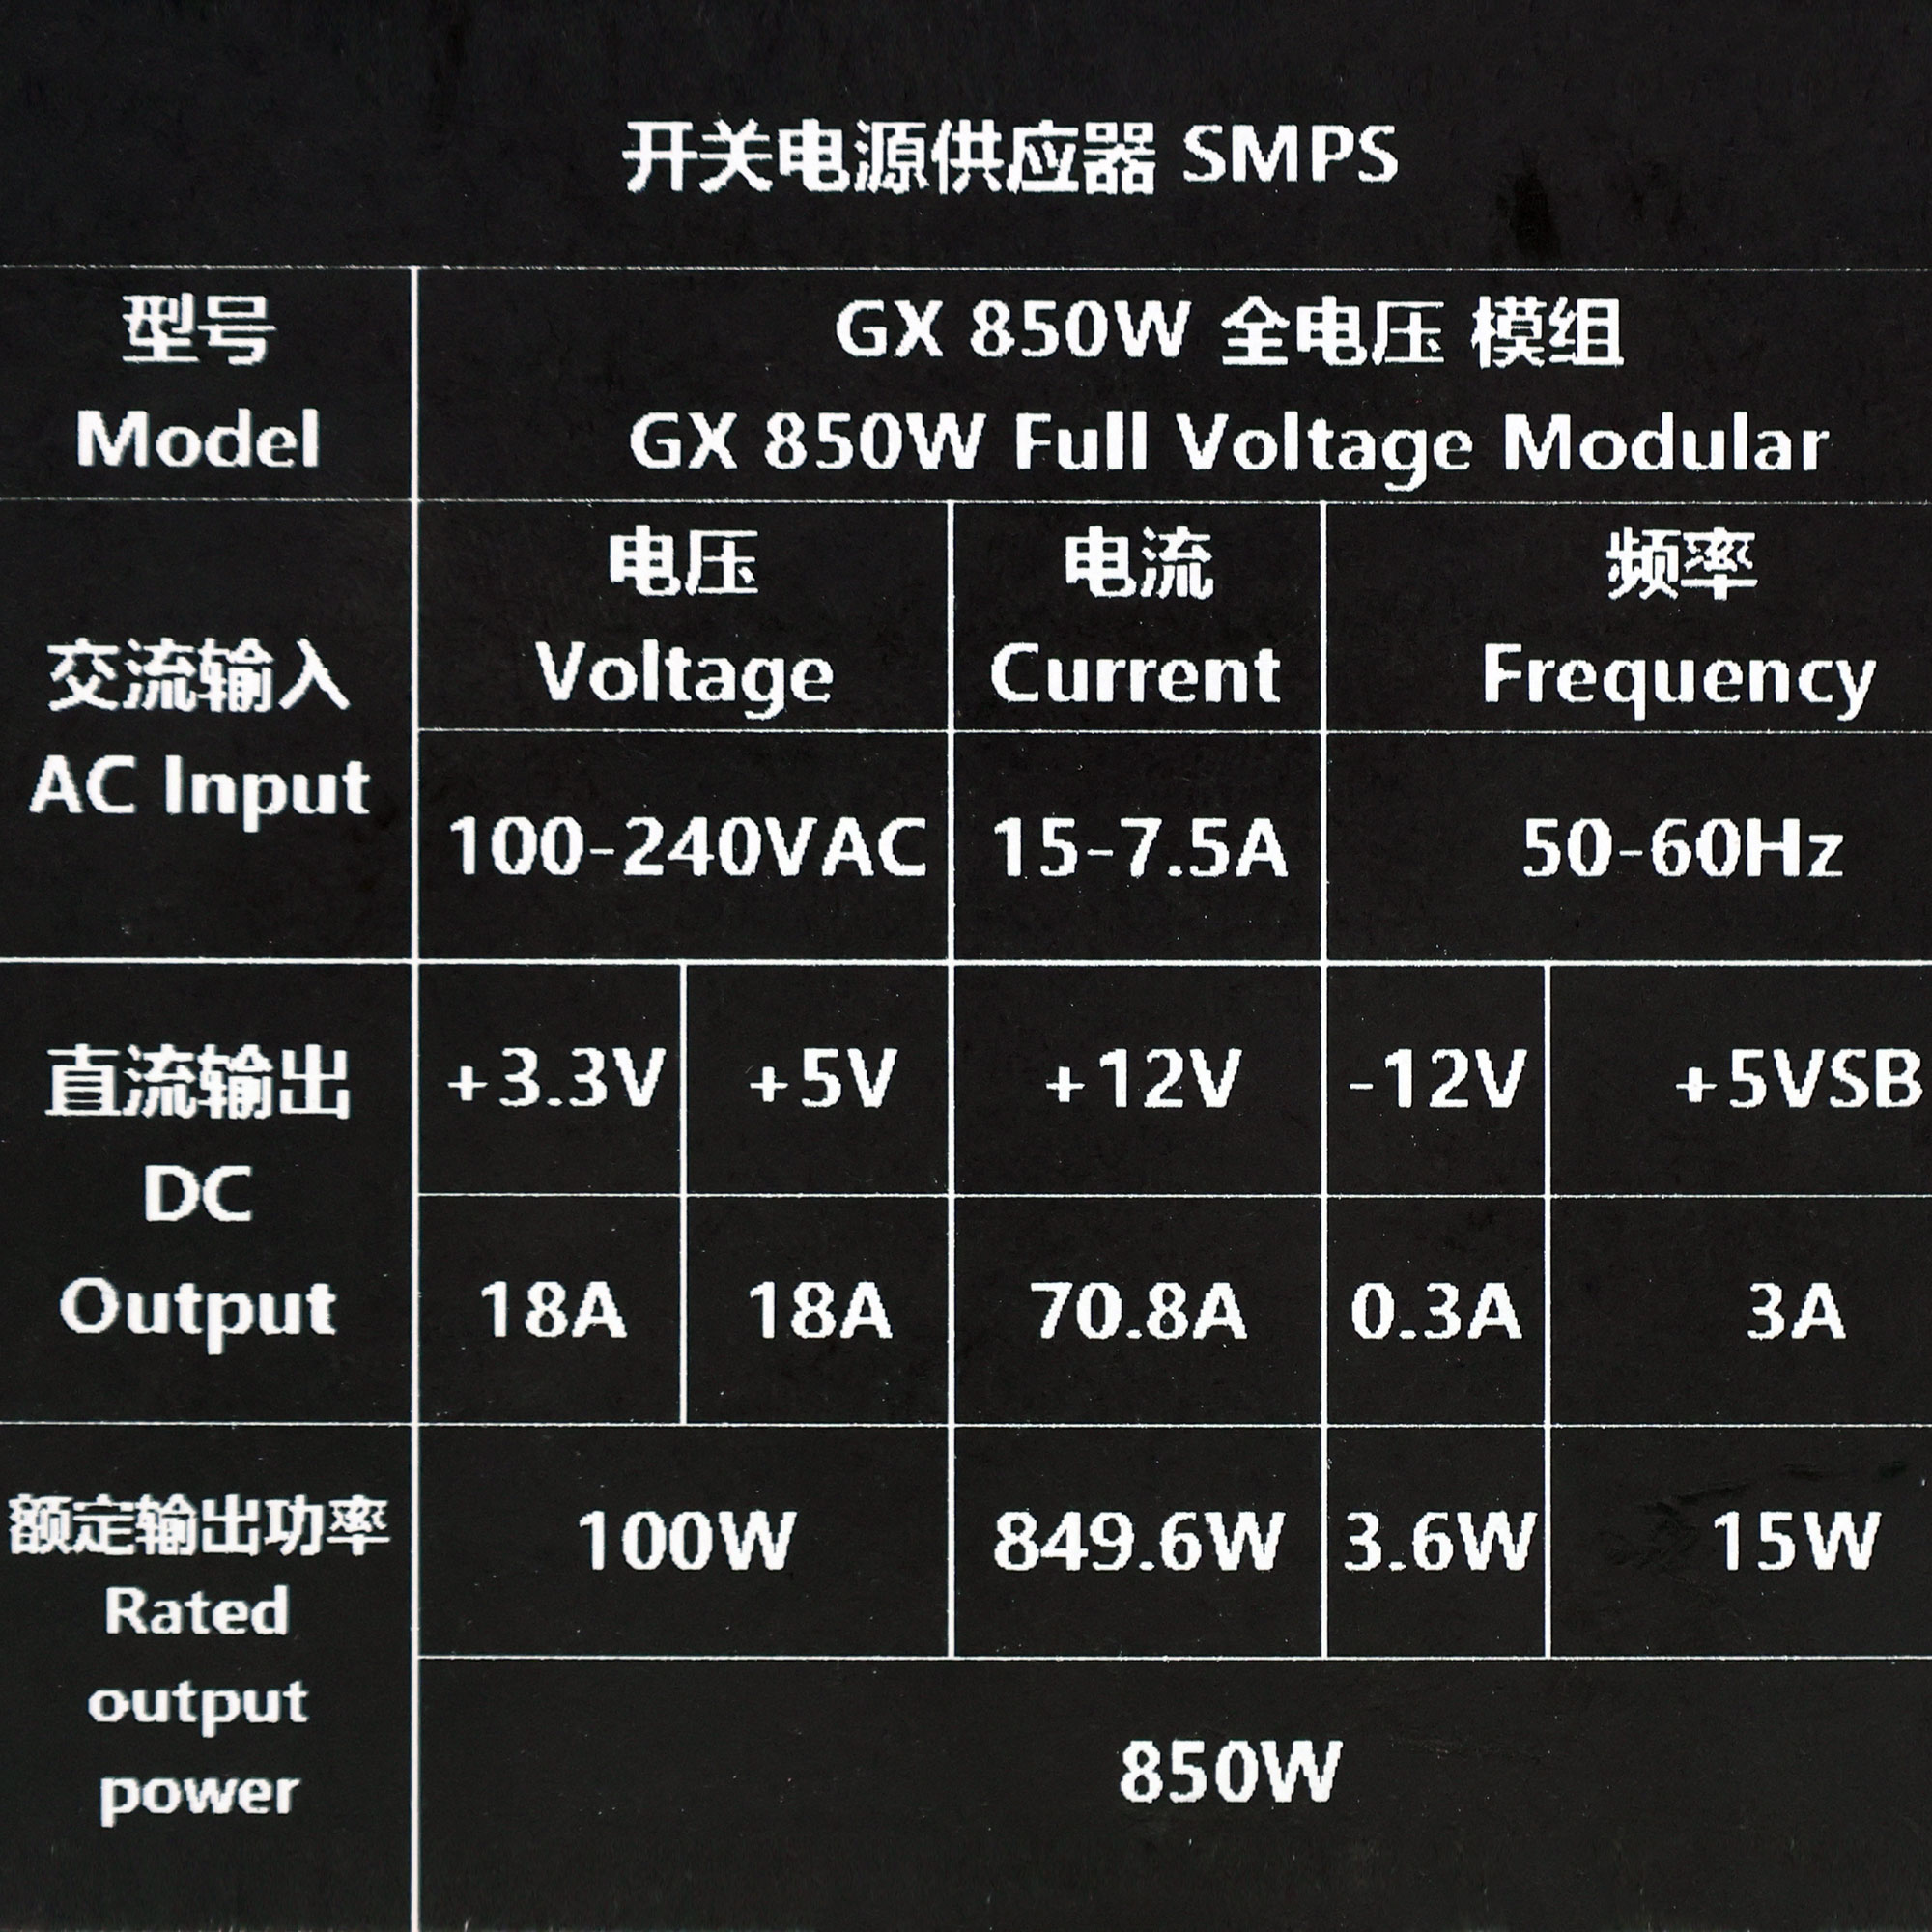
| Model | Creator 850W |
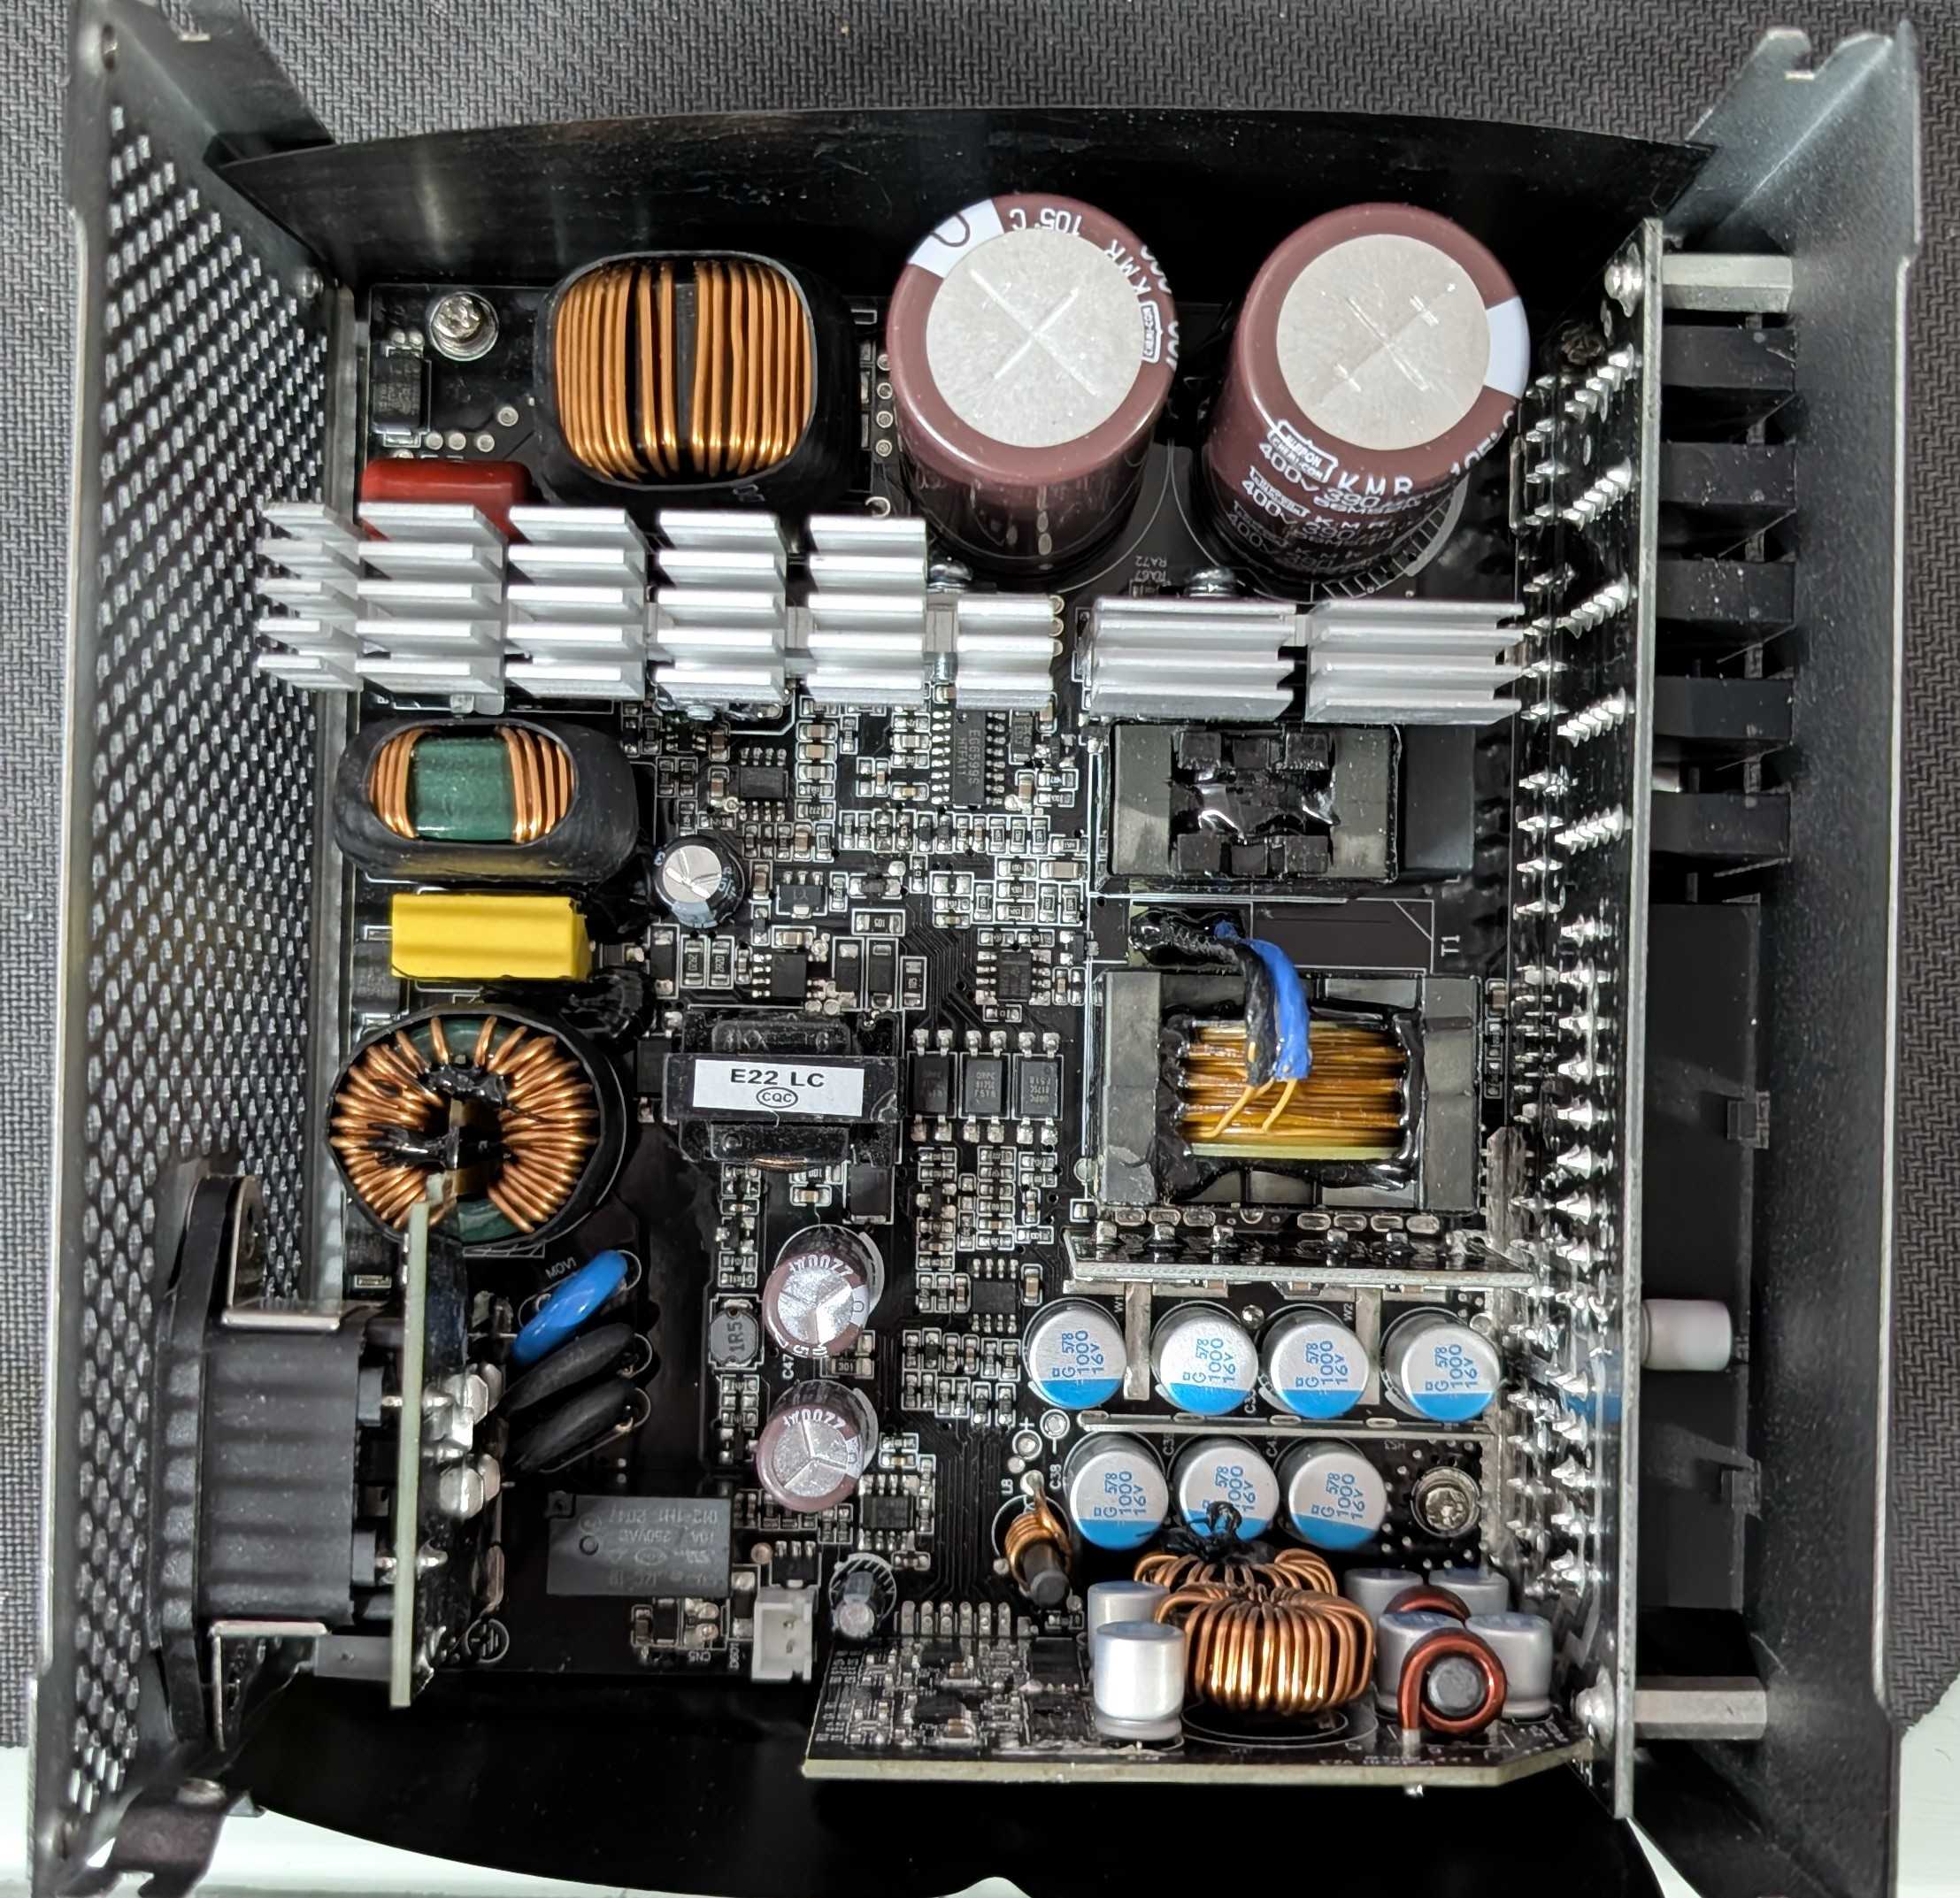
| OEM | Lemon ET |
| Serial Number | - |
| Product Specifications | |
| Manufacturer | |
| Rated Voltage (Vrms) | 100-240 |
| Rated Current (Arms) | 7.5-15 |
| Rated Frequency (Hz) | 50-60 |
| Rated Power (W) | 850 |
| Operating Temperature (Continuous Full Load) (°C) | 0 - 50 |
| Type | ATX12V |
| Cable Design | Fully Modular |
| Warranty | No Info |
| Cybenetics | |
| Dimensions (W x H x D) | 150 x 85 x 140mm |
| Weight | 1.22 kg (2.69 lb) |
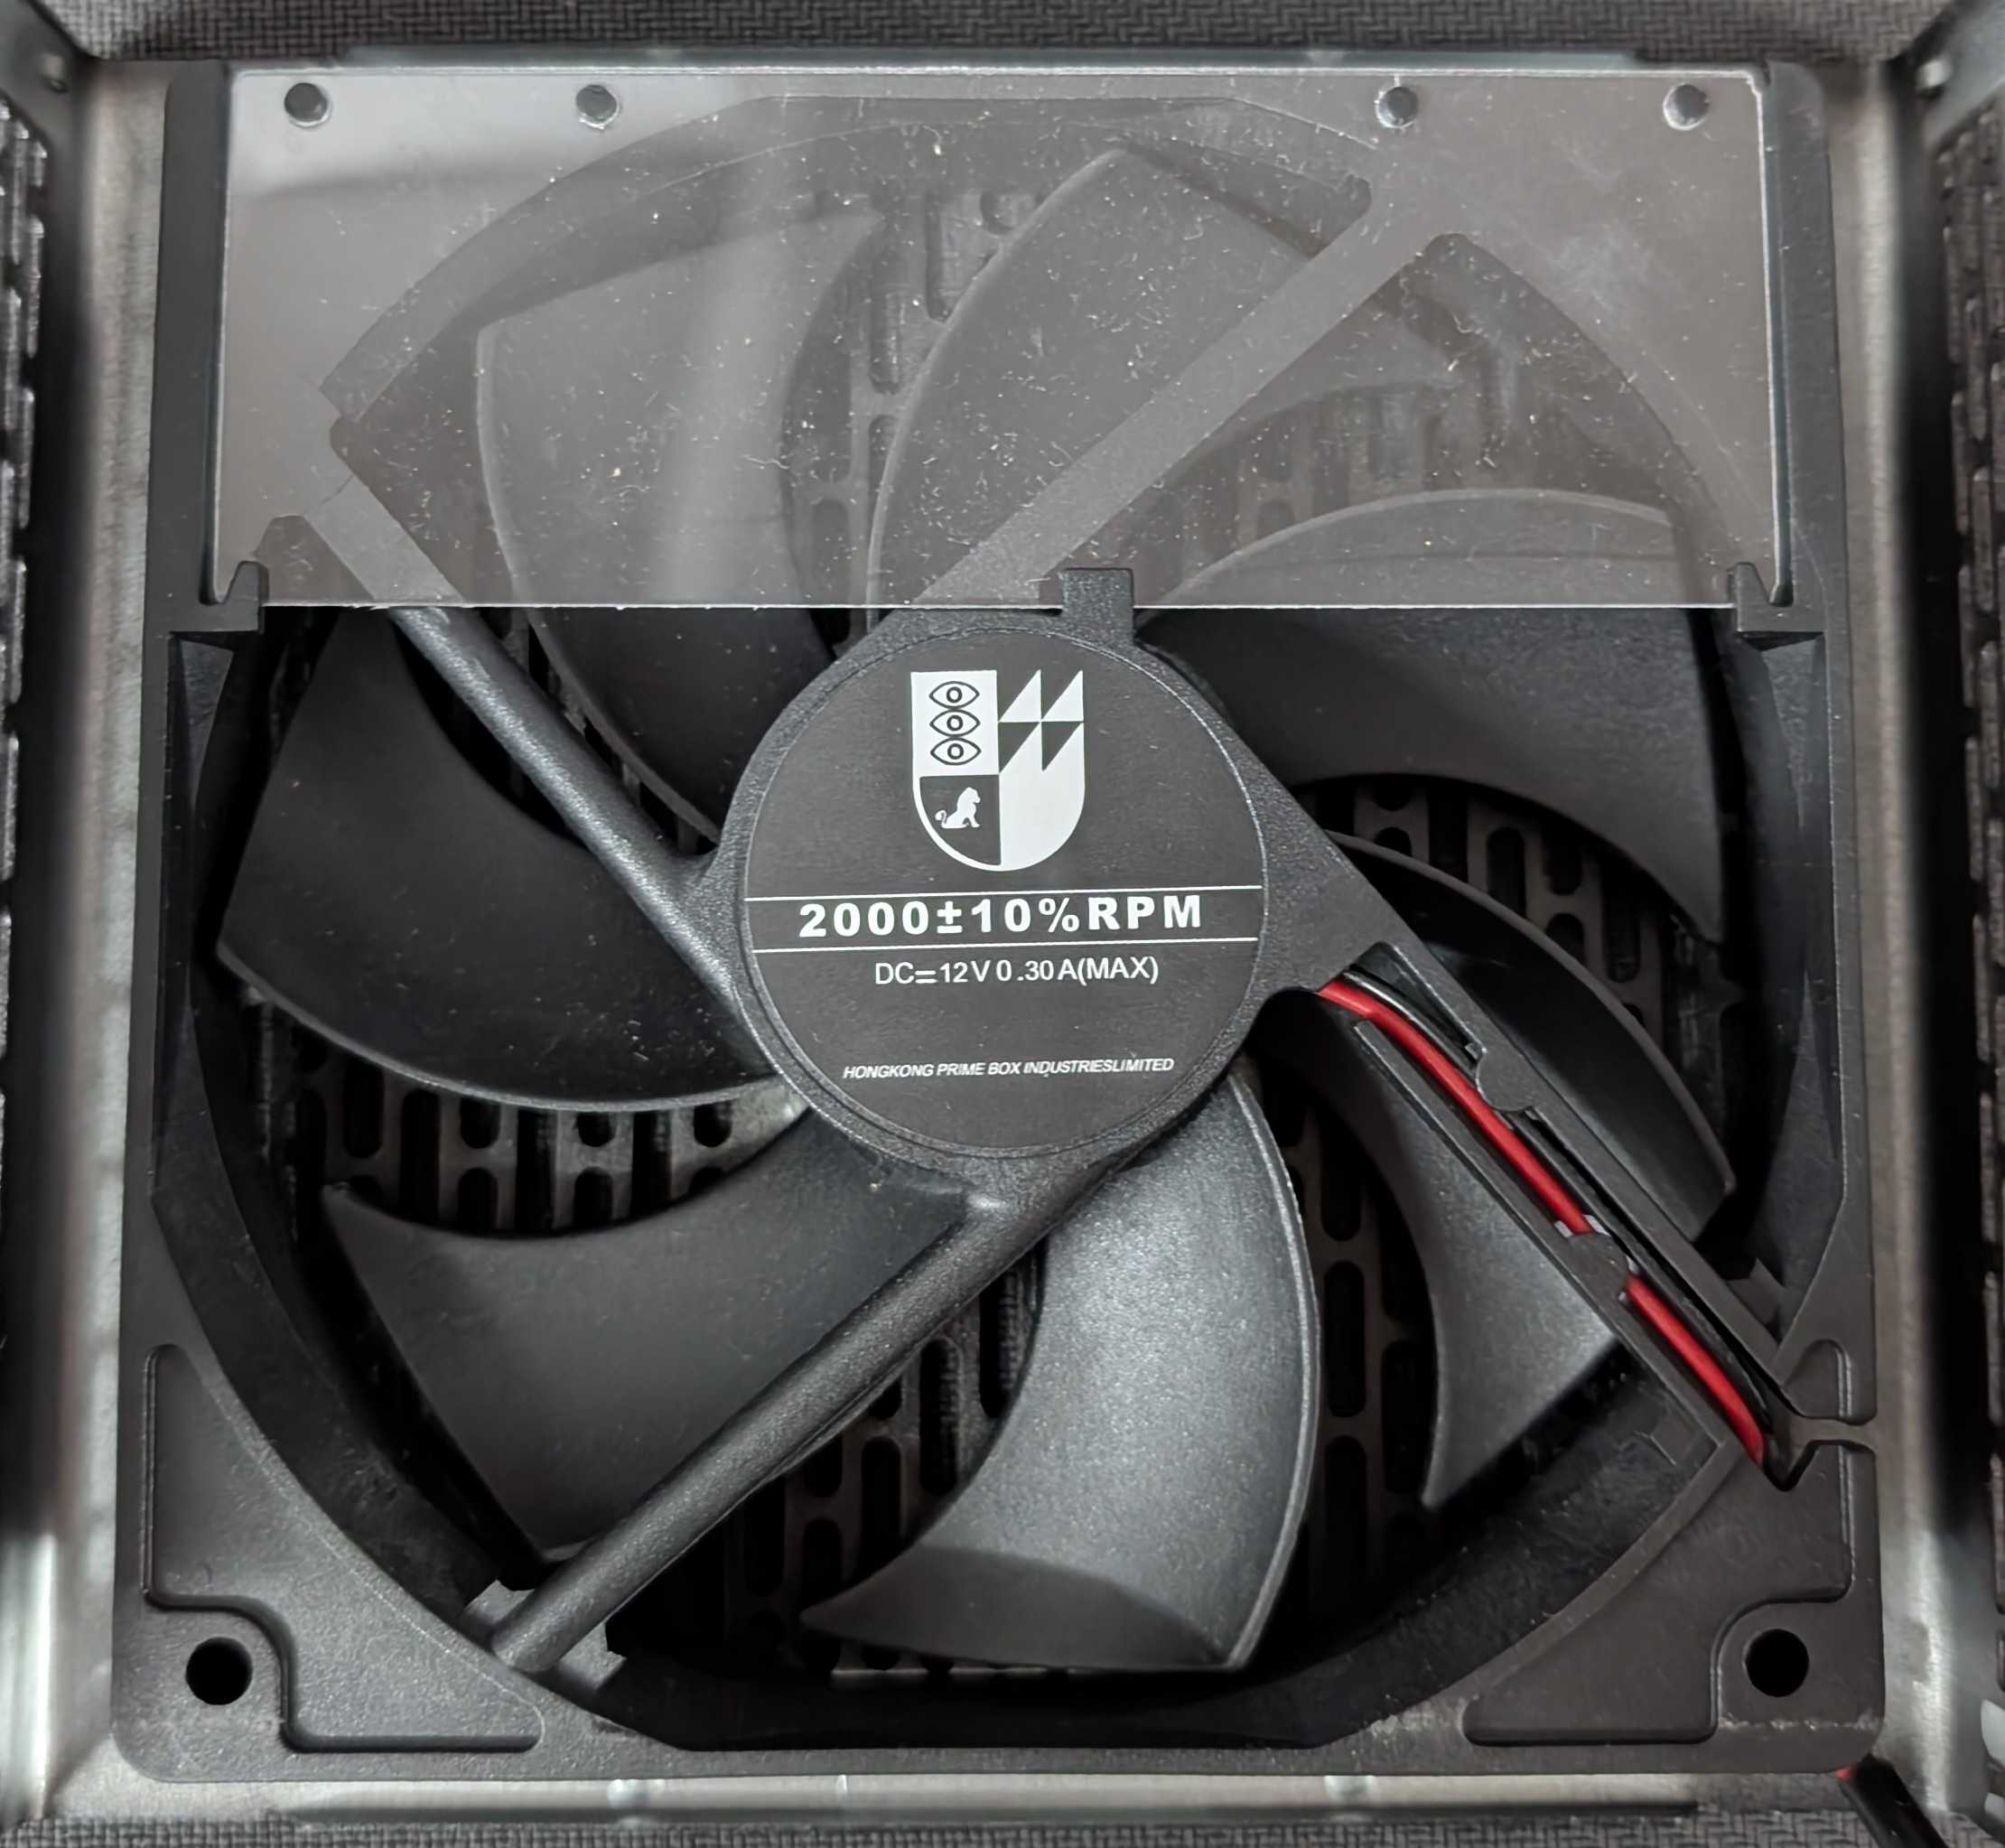
| Cooling | 120mm Fan 2000RPM (No other information) |
| Semi-Passive Operation | ✗ |
| Cybenetics Testing Information | |
| Lab ID | IP85003145 |
| Date of receipt | Jan 16, 2026 |
| Testing Date | Feb 17, 2026 |
| Report Issued Date | Feb 25, 2026 |
| DUT Notes | Some protection features need adjustment. |
| Engineer Name | Ioannis Kalyviotis |
| Authorized By the Laboratory Technical Manager | Aristeidis Bitziopoulos |
| Signature | |